May be bearish .
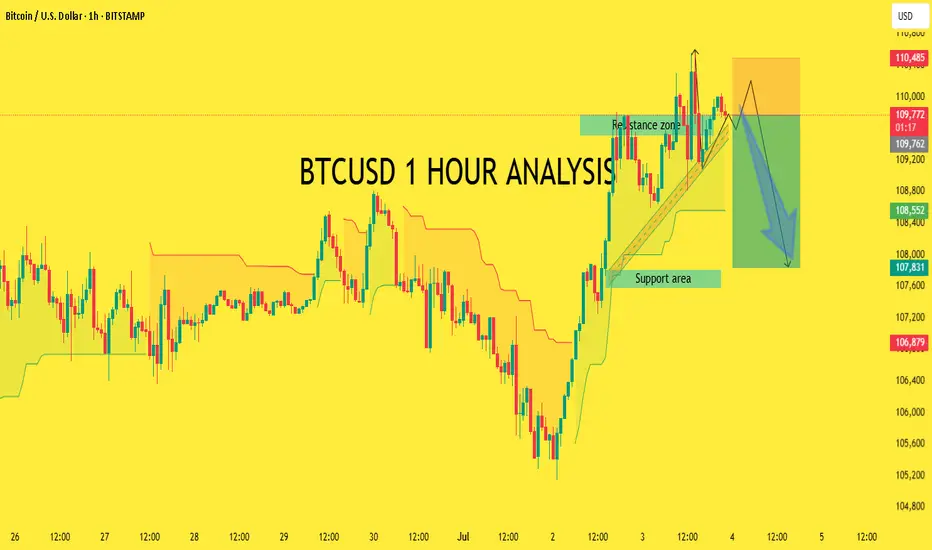
📊 Key Zones Identified
Support Area
Found near 107,800 – 108,400
Previously acted as resistance before the breakout, now expected to act as support.
Resistance Zone
Around 109,700 – 110,500
Price has touched this zone multiple times with signs of rejection wicks, suggesting potential selling pressure.
📉 Bearish Setup Indicated
Trendline Break Anticipated: The ascending trendline has been tested, and a potential break is forecasted.
Entry Zone: Just below 109,700 (marked on chart).
Stop Loss: Clearly indicated above 110,485, above the local high (to protect from a fakeout).
Target: A drop back toward the support zone (~107,800) or potentially lower, near 106,879.
🔁 Market Structure Insights
Price formed higher highs and higher lows, but now it’s consolidating near resistance.
The formation suggests a potential double top or lower high if the drop continues.
The blue arrow indicates a short (sell) trade opportunity after confirmation of breakdown.
🧠 Key Points to Consider
✅ Pros for Bearish Trade
Rejection in a key resistance zone
Overextended rally
Rising wedge/ascending channel breakdown pattern forming
Clear risk-to-reward setup
Trade closed: target reached
Congratullation guys our all target has been successfully hit around 250+PIPS in profit . ready for next setup.
Best Analysis xauusd single
t.me/+SAB5y_Kpm8RjYjlk
VIP PREMIMUM ANALYSIS ROOM SIGNALS
t.me/+SAB5y_Kpm8RjYjlk
t.me/+SAB5y_Kpm8RjYjlk
VIP PREMIMUM ANALYSIS ROOM SIGNALS
t.me/+SAB5y_Kpm8RjYjlk
Disclaimer
The information and publications are not meant to be, and do not constitute, financial, investment, trading, or other types of advice or recommendations supplied or endorsed by TradingView. Read more in the Terms of Use.