🔍 1. Overview of Structure & Context:
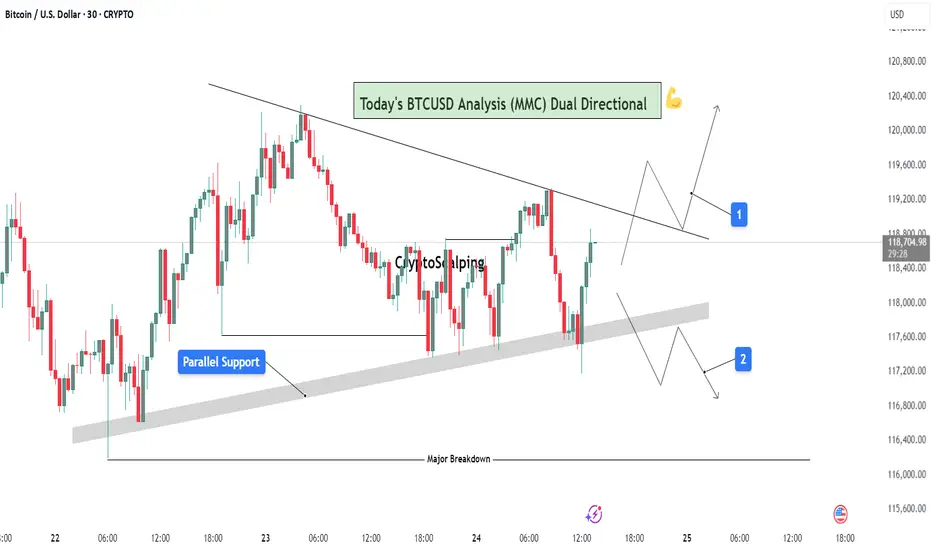
On the 30-minute timeframe, BTCUSD is consolidating between two strong technical zones:
A descending trendline acting as resistance
A parallel rising support forming a compression zone
This wedge-like formation signals a potential high-impact move in either direction — a dual-directional outlook. Price is currently testing the midpoint between resistance and support, offering two reactive trade scenarios.
🟦 2. Key Zones Highlighted on Chart:
🔹 A. Parallel Support Zone (Dynamic Support):
A grey-shaded rising support has been tested multiple times.
Each bounce suggests buying strength near this diagonal zone.
This zone represents smart money accumulation potential under MMC concepts.
As price approaches this zone again, bulls are expected to step in if momentum aligns.
🔹 B. Descending Resistance Line (Supply Line):
The market is facing lower highs, a sign of bearish control at higher levels.
Each retest of this line has led to a rejection.
This line also acts as a liquidity magnet — price may spike above it to trap buyers before dropping (false breakout potential).
🧭 3. Scenarios and Trade Possibilities (Dual Directional Path):
✅ Scenario 1: Bullish Breakout – (Marked as Path 1)
If BTC breaks above the descending trendline with strong bullish volume, this confirms a structural breakout.
This setup targets:
First level: $119,600
Second level: $120,200
Once broken, the trendline can flip into support.
Ideal confirmation:
Bullish engulfing candle on breakout
Retest of broken resistance turning into support
Volume surge or momentum indicators turning bullish
⚠️ Scenario 2: Bearish Rejection & Breakdown – (Marked as Path 2)
If BTC fails to break resistance and breaks below the parallel support zone, it opens a bearish scenario.
Price may fall back to:
First level: $117,200
Final key support: $116,400 (Major Breakdown Zone)
This is a typical MMC-style mirror move: a structure break leading to liquidity run toward a previous demand zone.
Bearish confirmation:
Close below grey zone
Lower high formation near resistance
Increasing bearish volume / weak bounce
📐 4. Strategy & Trading Tips (MMC Application):
Under the Mirror Market Concepts (MMC), these zones are not just technical levels — they represent emotional price memory of both institutional and retail players.
Wait for the reaction, not prediction.
Use confluence tools (RSI divergence, volume, candle patterns).
Avoid trading inside the wedge — it's a trap zone.
Ideal entries are at breakout with retest confirmation or rejection from major zones.
📊 Risk Management Plan:
Entry Type Trigger Level SL Suggestion TP Range
Long Trade Break & retest above $118.8K Below $118.2K $119.6K → $120.2K
Short Trade Breakdown below $117.8K Above $118.2K $117.2K → $116.4K
🧠 Conclusion:
BTC is in a decision-making zone between a downward pressure line and strong support. A breakout could lead to a clean trend continuation, while a breakdown would trigger bearish momentum. The chart reflects precision MMC logic, offering a tactical map for day traders and scalpers to follow the smart money — not the noise.
Let the market decide direction. We just need to be prepared, not predictive.
For Daily Trade Setups and Forecast: 📈 t.me/xauusdoptimizer
Premium Signals Fr33: 💯 t.me/xauusdoptimizer
🥰🥳🤩
Premium Signals Fr33: 💯 t.me/xauusdoptimizer
🥰🥳🤩
Related publications
Disclaimer
The information and publications are not meant to be, and do not constitute, financial, investment, trading, or other types of advice or recommendations supplied or endorsed by TradingView. Read more in the Terms of Use.