This is my first chart using TradingView. I'm 50/50 on how I feel about it's utility, but it does well enough until I learn it better. I use the D Timeframe too look for support/resistance. I focus in on the 4h, then 1h further. I have recently switched from lower timeframes to higher timeframes with some surprising success following my rules. Constructive Criticism/Dialogue welcomed.
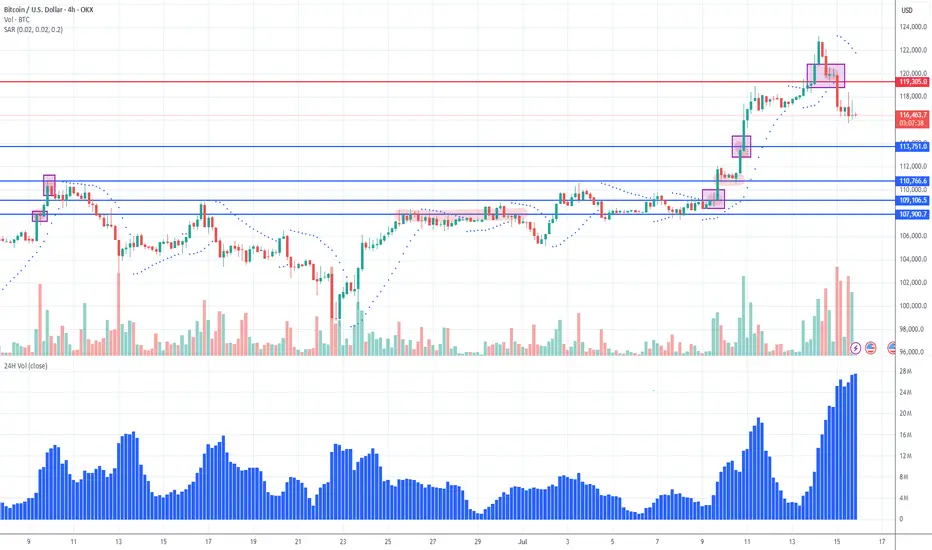
It is time for a reversal. Why? Those ATHs were just hit after two bullish runs for 2025 (Jan and July). Granted it would be hopeful for all investors to keep seeing this beast rip for a 3rd time in 2025, that is a dream, I think. There has been two runs then consolidation/pullbacks, NORMALLY (see hollow boxes on chart). This does not mean this is the case, but this is what I am going with after researching. After the ATH, a lovely wick and an incredibly high volume on an engulfing candle formed. This along with a PSAR switch on the 4H is what I utilize. I have only researched down to $102k. Each TP (blue line), I will be looking for a sign of reversal on the 4h.
Key:
Blue lines:
- My TP
Boxes:
- Areas of Interest
Hollow Boxes only:
- Shows two runs before a consolidation to an official breakout
Highlights:
- What within that area of interest I'm using for justification
Orange lines:
- Where in the past BTC has had breakouts then a retest before the next breakout
Red line:
- My SL
Enjoy your BTC,
AtlasRising
Trade active
SL adjusted to $122k. Also, my long term chart didn't copy correctly. I'm still learning TradingView. Shown here is only the 4h chart. Disclaimer
The information and publications are not meant to be, and do not constitute, financial, investment, trading, or other types of advice or recommendations supplied or endorsed by TradingView. Read more in the Terms of Use.
Disclaimer
The information and publications are not meant to be, and do not constitute, financial, investment, trading, or other types of advice or recommendations supplied or endorsed by TradingView. Read more in the Terms of Use.