Simple, as the title suggests:

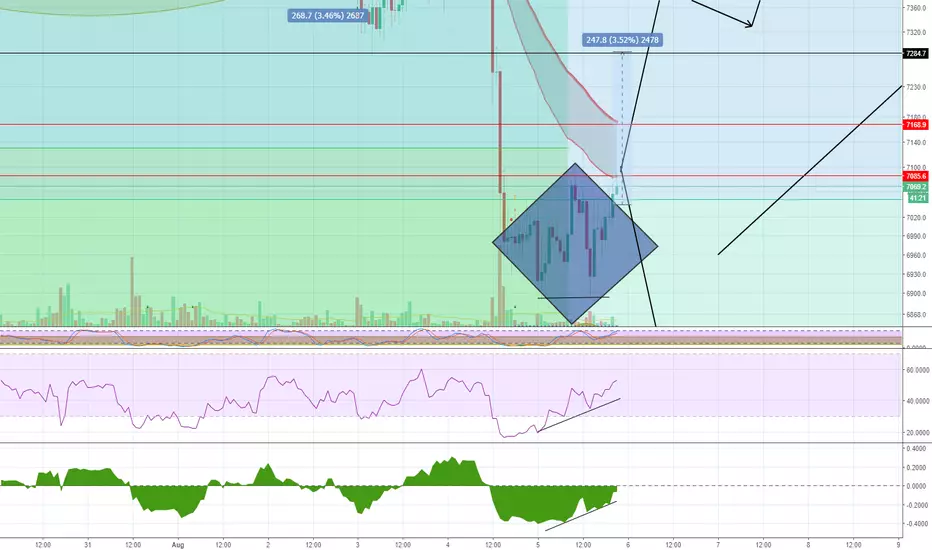
Most of the volume located at the centre of the formation (Most expanded price range), and we are breaking up with volume.
RSI and CMF with bullish divergence. Resistance at the 2 red lines around 7100 and 7170. If those two get taken out my first target would be the measured of the formation around 7280 and a reassess from there.
The Daily is showing a nice reversal doji forming after many red days, more than we have had since mid 2017 on the Daily chart, coming off the back of a perfect sequential 9 sell thirteen days ago.

If I were short, here is where I would start to close some of my positions, or hedge for a possible move upward. The STOCH is also giving you a ver nice setup for a swing to the upside after breaking down into oversold condition.
Nothing is certain, but these are my thoughts. Do your own research and own your own decisions.
Peace out!
Most of the volume located at the centre of the formation (Most expanded price range), and we are breaking up with volume.
RSI and CMF with bullish divergence. Resistance at the 2 red lines around 7100 and 7170. If those two get taken out my first target would be the measured of the formation around 7280 and a reassess from there.
The Daily is showing a nice reversal doji forming after many red days, more than we have had since mid 2017 on the Daily chart, coming off the back of a perfect sequential 9 sell thirteen days ago.
If I were short, here is where I would start to close some of my positions, or hedge for a possible move upward. The STOCH is also giving you a ver nice setup for a swing to the upside after breaking down into oversold condition.
Nothing is certain, but these are my thoughts. Do your own research and own your own decisions.
Peace out!
Disclaimer
The information and publications are not meant to be, and do not constitute, financial, investment, trading, or other types of advice or recommendations supplied or endorsed by TradingView. Read more in the Terms of Use.
Disclaimer
The information and publications are not meant to be, and do not constitute, financial, investment, trading, or other types of advice or recommendations supplied or endorsed by TradingView. Read more in the Terms of Use.