Quick Look at Bitcoin (BTC/USD) on the 1-Hour Chart - Kraken
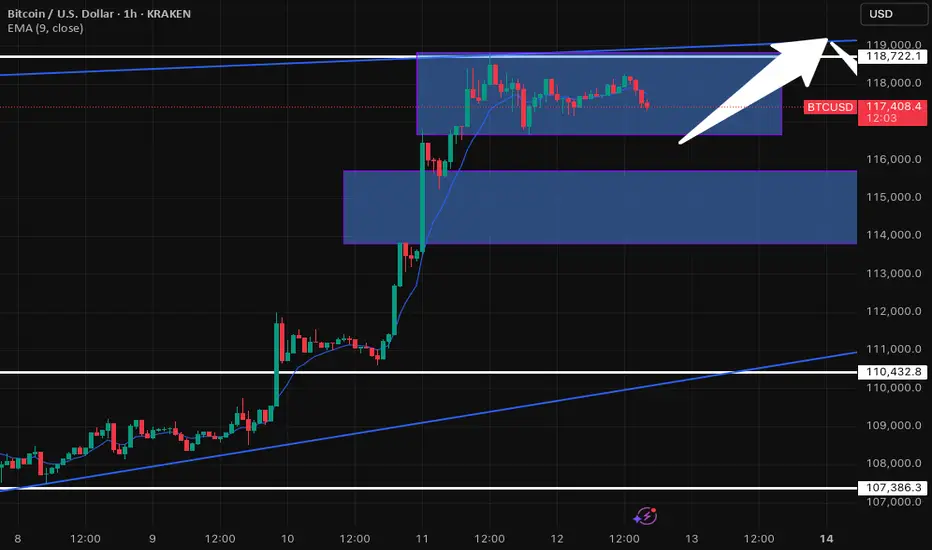
Alright, let's dive into what Bitcoin's doing on the 1-hour chart. We've seen BTC in a pretty solid uptrend lately, cruising nicely within that ascending channel. It recently had a fantastic run, pushing right past the $110,432.8 resistance level – a great sign!
But now, it looks like Bitcoin is taking a breather. It's currently consolidating in that upper blue box, roughly hanging out between $116,000 and $118,000. This kind of sideways movement often means the market is trying to figure out its next big move after a strong push. Are buyers reloading, or are sellers starting to step in? That's the big question.
Here's what I'm keeping an eye on:
On the Upside: The immediate hurdle is the top of this current consolidation range, right around $118,722.1, which also lines up with the upper trendline of our channel. If Bitcoin can break convincingly above that, we could see another leg up – definitely a bullish signal!
On the Downside: If it can't hold this range and starts to dip, the first area of interest for support is that lower blue box, roughly $114,000 to $115,000. That's where I'd expect some buyers to potentially step back in.
Stronger Safety Nets: Don't forget that $110,432.8 level. It was tough resistance before, so it should now act as a pretty strong support if we see a deeper pullback. And, of course, the bottom trendline of our ascending channel and $107,386.3 are there as well.
My Takeaway:
Bitcoin's in a strong position overall, but this consolidation is key. The next big move will tell us a lot. Keep an eye on those breakout or breakdown points – that's where the action will be!
Disclaimer
The information and publications are not meant to be, and do not constitute, financial, investment, trading, or other types of advice or recommendations supplied or endorsed by TradingView. Read more in the Terms of Use.
Disclaimer
The information and publications are not meant to be, and do not constitute, financial, investment, trading, or other types of advice or recommendations supplied or endorsed by TradingView. Read more in the Terms of Use.