⊣
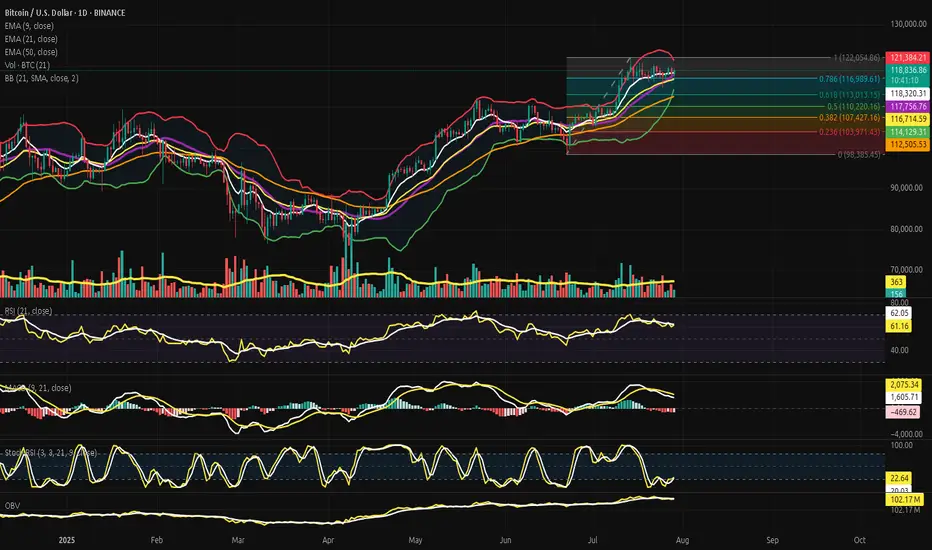
⟁ BTC/USD - BINANCE - (CHART: 1D) - (Jul 29, 2025).
◇ Analysis Price: $118,996.40.
⊣
⨀ I. Temporal Axis - Strategic Interval - (1D):
▦ EMA9 - (Exponential Moving Average 9) - ($118,352.22):
∴ This short-term exponential blade reflects immediate price sensitivity, showing reactive balance across recent closes;
∴ Price currently floats above this threshold, indicating micro-support for the bulls - a soft floor in the fog of uncertainty;
∴ The EMA9 line curves gently upward, though not sharply - signaling lingering momentum, but without fury.
✴️ Conclusion: EMA9 acts as a dynamic support amid deceleration; a watchful line between calm consolidation and renewed ascent.
⊢
▦ EMA21 - (Exponential Moving Average 21) - ($116,729.10):
∴ This mid-range trend beacon provides clearer directional context - its upward slope holds the spell of continuity;
∴ Price rests safely above this median force, confirming bullish alignment;
∴ However, the arc begins to curve with less conviction, a signal that the current push is softening.
✴️ Conclusion: EMA21 maintains bullish structure but foretells potential slowing; if momentum dims further, this level may serve as magnet for retracement.
⊢
▦ EMA50 - (Exponential Moving Average 50) - ($112,511.79):
∴ The long-arm average projects the memory of the trend - the deep root under the recent canopy;
∴ Price is far above this line, a sign of strong prior conviction from bulls;
∴ Its firm inclination remains intact, yet price distance signals risk of gravitational return should upper momentum fracture.
✴️ Conclusion: EMA50 preserves bullish foundation, but may become a zone of rebalancing if the rally loses vitality.
⊢
▦ BB (21) - (Bollinger Bands + SMA21) - ($117,764.35):
∴ The Bands, ever sensitive to volatility’s breath, expand wide - a sign of elevated tension and price exploration;
∴ Price nears the upper band ($121,401.48), a common altar for speculative saturation and potential rejections;
∴ The median band (SMA) acts as equilibrium, now beneath the price - suggesting deviation from balance.
✴️ Conclusion: BB21 signals a volatile climax zone; price at the upper band often faces a verdict - continuation by force, or descent by default.
⊢
▦ Volume + MA21 - (Last - 148 vs Average - 363):
∴ Volume flows now with diminished voice - the current bar echoes only 148 units against a historical pulse of 363;
∴ Such silence beneath a rising price may betray a hollow rally - or a pause before engagement;
∴ Absence of participation often precedes reversal or sudden liquidity spikes.
✴️ Conclusion: Subdued volume undermines the bullish signal - lack of validation breeds caution in forward projection.
⊢
▦ RSI - (Relative Strength Index 21) - (61.41):
∴ RSI remains in neutral-high territory, not overbought, but clearly tilted toward bullish control;
∴ Momentum persists but shows signs of plateau - recent movement flattens after steady ascent;
∴ Without new strength, RSI may drift toward the median.
✴️ Conclusion: RSI shows bullish favor, but the fire beneath the trend cools; next candles will determine if it's pause or fade.
⊢
▦ MACD - (9, 21) - (Histogram: –455.70):
∴ MACD line at 2,078.82 vs Signal line at 1,623.12 suggests bullish dominance in structure;
∴ Yet the negative histogram tells a story of fading acceleration - as if the charge slows though direction holds;
∴ This divergence signals decay beneath strength, an omen of indecision.
✴️ Conclusion: MACD is structurally bullish, but its weakening impulse demands attention - the momentum candle dims.
⊢
▦ StochRSI - (3, 3, 21, 9) - (%K: 20.46 / %D: 23.93):
∴ The indicator rests near the lower bounds (sub-25) - a territory of emotional exhaustion and tactical reversion;
∴ A cross upward from these levels often ignites short-term rally pulses;
∴ No confirmed crossover yet - but proximity speaks of potential awakening.
✴️ Conclusion: StochRSI breathes in the lowlands, poised to reverse if kinetic force is summoned.
⊢
▦ OBV - (On Balance Volume) - (102.17M):
∴ The OBV remains elevated, suggesting previous bullish runs were volume-supported, not hollow;
∴ However, flatness in recent OBV progression warns that fresh volume is not accompanying the current price hold;
∴ It whispers of consolidation, or worse - divergence.
✴️ Conclusion: OBV confirms the history of strength, but offers no new blood to feed the advance.
⊢
🜎 Strategic Insight - Technical Oracle:
∴ The battlefield holds its shape - the banners of bullish trend still wave, upheld by structural support from EMA's and historical OBV flow. But the wind... it stills.
∴ Volume fades, momentum indicators lose their incline, and oscillators rest on edges. This is a moment of price levitation - elevated without lift. The form remains, but the force hesitates.
∴ The Arcane Pattern whispers:
∴ The Vortex of Pause has formed. From here, either ignition... or gravity.
⊢
𓂀 Stoic-Structural Interpretation:
▦ Structurally Bullish - Strategically Cautious:
∴ Price remains securely above all major (EMA's 9/21/50) on the daily chart, preserving directional integrity;
∴ Bollinger Bands expanded near upper thresholds, signaling climax zone - yet not rupture;
∴ Momentum indicators (MACD, RSI) maintain bullish structure, but histogram weakness and RSI flattening warn of interior softening;
∴ Stoch RSI in low-band suggests reversal potential, but has yet to trigger.
✴️ Conclusion: Market structure supports continuation, but momentum exhaustion and low volume raise caution flags. Bulls hold the field - but must call the wind.
⊢
▦ Tactical Range Outlook:
∴ Upper Limit: $122,054 - Fibonacci 1.0 and previous cycle top;
∴ Short-Term Support: $118,352 - EMA9 + 0.618 Fib confluence;
∴ Median Guard: $116,729 - EMA21 + 0.382 Fib;
∴ Sacred Support: $112,511 - EMA50 base + structural floor;
∴ Final Bastion: $103,971 - 0.236 Fib retrace (macro turn pivot).
✴️ Conclusion: Bullish path remains sealed while price resides above EMA50 and above $103K. Breach of that zone could awaken deeper volatility structures.
⊢
◩ Codicillus Silentii - Strategic Note:
∴ Price stands at the edge of Fibonacci climax, just below the mythic $122K - a known threshold of reaction;
∴ Volume whispers, not commands - the force of momentum now rests on belief, not confirmation;
∴ The convergence of structure without influx invites caution. This is the realm not of action, but of observation.
✴️ Final Seal: Beware the illusion of calm. A structure may stand in silence, but silence precedes collapse as often as continuation. The Sacred Frame is intact - but shall remain sacred only through vigilance.
⊢
⧉
· Cryptorvm Dominvs · MAGISTER ARCANVM · Vox Primordialis ·
⚜️ ⌬ - Silence precedes the next force. Structure is sacred - ⌬ ⚜️
⧉
⊢
⟁ BTC/USD - BINANCE - (CHART: 1D) - (Jul 29, 2025).
◇ Analysis Price: $118,996.40.
⊣
⨀ I. Temporal Axis - Strategic Interval - (1D):
▦ EMA9 - (Exponential Moving Average 9) - ($118,352.22):
∴ This short-term exponential blade reflects immediate price sensitivity, showing reactive balance across recent closes;
∴ Price currently floats above this threshold, indicating micro-support for the bulls - a soft floor in the fog of uncertainty;
∴ The EMA9 line curves gently upward, though not sharply - signaling lingering momentum, but without fury.
✴️ Conclusion: EMA9 acts as a dynamic support amid deceleration; a watchful line between calm consolidation and renewed ascent.
⊢
▦ EMA21 - (Exponential Moving Average 21) - ($116,729.10):
∴ This mid-range trend beacon provides clearer directional context - its upward slope holds the spell of continuity;
∴ Price rests safely above this median force, confirming bullish alignment;
∴ However, the arc begins to curve with less conviction, a signal that the current push is softening.
✴️ Conclusion: EMA21 maintains bullish structure but foretells potential slowing; if momentum dims further, this level may serve as magnet for retracement.
⊢
▦ EMA50 - (Exponential Moving Average 50) - ($112,511.79):
∴ The long-arm average projects the memory of the trend - the deep root under the recent canopy;
∴ Price is far above this line, a sign of strong prior conviction from bulls;
∴ Its firm inclination remains intact, yet price distance signals risk of gravitational return should upper momentum fracture.
✴️ Conclusion: EMA50 preserves bullish foundation, but may become a zone of rebalancing if the rally loses vitality.
⊢
▦ BB (21) - (Bollinger Bands + SMA21) - ($117,764.35):
∴ The Bands, ever sensitive to volatility’s breath, expand wide - a sign of elevated tension and price exploration;
∴ Price nears the upper band ($121,401.48), a common altar for speculative saturation and potential rejections;
∴ The median band (SMA) acts as equilibrium, now beneath the price - suggesting deviation from balance.
✴️ Conclusion: BB21 signals a volatile climax zone; price at the upper band often faces a verdict - continuation by force, or descent by default.
⊢
▦ Volume + MA21 - (Last - 148 vs Average - 363):
∴ Volume flows now with diminished voice - the current bar echoes only 148 units against a historical pulse of 363;
∴ Such silence beneath a rising price may betray a hollow rally - or a pause before engagement;
∴ Absence of participation often precedes reversal or sudden liquidity spikes.
✴️ Conclusion: Subdued volume undermines the bullish signal - lack of validation breeds caution in forward projection.
⊢
▦ RSI - (Relative Strength Index 21) - (61.41):
∴ RSI remains in neutral-high territory, not overbought, but clearly tilted toward bullish control;
∴ Momentum persists but shows signs of plateau - recent movement flattens after steady ascent;
∴ Without new strength, RSI may drift toward the median.
✴️ Conclusion: RSI shows bullish favor, but the fire beneath the trend cools; next candles will determine if it's pause or fade.
⊢
▦ MACD - (9, 21) - (Histogram: –455.70):
∴ MACD line at 2,078.82 vs Signal line at 1,623.12 suggests bullish dominance in structure;
∴ Yet the negative histogram tells a story of fading acceleration - as if the charge slows though direction holds;
∴ This divergence signals decay beneath strength, an omen of indecision.
✴️ Conclusion: MACD is structurally bullish, but its weakening impulse demands attention - the momentum candle dims.
⊢
▦ StochRSI - (3, 3, 21, 9) - (%K: 20.46 / %D: 23.93):
∴ The indicator rests near the lower bounds (sub-25) - a territory of emotional exhaustion and tactical reversion;
∴ A cross upward from these levels often ignites short-term rally pulses;
∴ No confirmed crossover yet - but proximity speaks of potential awakening.
✴️ Conclusion: StochRSI breathes in the lowlands, poised to reverse if kinetic force is summoned.
⊢
▦ OBV - (On Balance Volume) - (102.17M):
∴ The OBV remains elevated, suggesting previous bullish runs were volume-supported, not hollow;
∴ However, flatness in recent OBV progression warns that fresh volume is not accompanying the current price hold;
∴ It whispers of consolidation, or worse - divergence.
✴️ Conclusion: OBV confirms the history of strength, but offers no new blood to feed the advance.
⊢
🜎 Strategic Insight - Technical Oracle:
∴ The battlefield holds its shape - the banners of bullish trend still wave, upheld by structural support from EMA's and historical OBV flow. But the wind... it stills.
∴ Volume fades, momentum indicators lose their incline, and oscillators rest on edges. This is a moment of price levitation - elevated without lift. The form remains, but the force hesitates.
∴ The Arcane Pattern whispers:
- Should volume return and MACD reignite, $121K may be pierced with clarity;
- If silence deepens, however, the bands will contract, and price may descend toward EMA21 or even test EMA50.
∴ The Vortex of Pause has formed. From here, either ignition... or gravity.
⊢
𓂀 Stoic-Structural Interpretation:
▦ Structurally Bullish - Strategically Cautious:
∴ Price remains securely above all major (EMA's 9/21/50) on the daily chart, preserving directional integrity;
∴ Bollinger Bands expanded near upper thresholds, signaling climax zone - yet not rupture;
∴ Momentum indicators (MACD, RSI) maintain bullish structure, but histogram weakness and RSI flattening warn of interior softening;
∴ Stoch RSI in low-band suggests reversal potential, but has yet to trigger.
✴️ Conclusion: Market structure supports continuation, but momentum exhaustion and low volume raise caution flags. Bulls hold the field - but must call the wind.
⊢
▦ Tactical Range Outlook:
∴ Upper Limit: $122,054 - Fibonacci 1.0 and previous cycle top;
∴ Short-Term Support: $118,352 - EMA9 + 0.618 Fib confluence;
∴ Median Guard: $116,729 - EMA21 + 0.382 Fib;
∴ Sacred Support: $112,511 - EMA50 base + structural floor;
∴ Final Bastion: $103,971 - 0.236 Fib retrace (macro turn pivot).
✴️ Conclusion: Bullish path remains sealed while price resides above EMA50 and above $103K. Breach of that zone could awaken deeper volatility structures.
⊢
◩ Codicillus Silentii - Strategic Note:
∴ Price stands at the edge of Fibonacci climax, just below the mythic $122K - a known threshold of reaction;
∴ Volume whispers, not commands - the force of momentum now rests on belief, not confirmation;
∴ The convergence of structure without influx invites caution. This is the realm not of action, but of observation.
✴️ Final Seal: Beware the illusion of calm. A structure may stand in silence, but silence precedes collapse as often as continuation. The Sacred Frame is intact - but shall remain sacred only through vigilance.
⊢
⧉
· Cryptorvm Dominvs · MAGISTER ARCANVM · Vox Primordialis ·
⚜️ ⌬ - Silence precedes the next force. Structure is sacred - ⌬ ⚜️
⧉
⊢
Trade active
⊣⟁ BTC/USD - BINANCE - (CHART: 1D) - (Jul 30, 2025).
⟴
⊣
⨀ I. Temporal Axis - Strategic Interval - (1D):
▦ BB - (21, 2) - Severely Compressed:
∴ Bands are tightening dramatically, indicating imminent volatility expansion;
∴ The baseline (SMA 21) holds a fragile horizontal position;
∴ Price is touching the upper band but lacks breakout strength.
✴️ Conclusion: Terminal compression detected - volatility rupture likely ahead.
⊢
▦ RSI - (21, 9) - (60.97):
∴ Descending curvature from prior 70.00 peak;
∴ Gradual weakening of bullish momentum;
∴ Still within neutral range, but at risk of losing 60-line support.
✴️ Conclusion: Relative strength weakening; potential drop toward midline.
⊢
▦ MACD - (9, 21) - (-619.55):
∴ MACD line has crossed below the signal line;
∴ Histogram showing consistent red bars - (bearish momentum building);
∴ Clear negative divergence confirmed.
✴️ Conclusion: Momentum has shifted decisively to the downside.
⊢
▦ STOCH-RSI - (3, 3, 21, 9) - (11.63):
∴ Indicator approaching absolute floor - (oversold);
∴ No reversal signal forming yet;
∴ Locked in a prolonged exhaustion state.
✴️ Conclusion: Technically exhausted, but no recovery signal yet.
⊢
▦ OBV - (21, 2) - (102.17M):
∴ OBV line shows flat movement;
∴ No clear accumulation or distribution;
∴ No major divergences visible.
✴️ Conclusion: Volume flow is neutral, but lacks conviction.
⊢
🜎 Strategic Insight - Technical Oracle:
∴ The sharp constriction in Bollinger Bands whispers of a pending directional burst. Both RSI and MACD point toward a weakening bull, with the Stochastic RSI descending into inert terrain;
∴ However, the Exponential Moving Averages (EMA21: $116,695 | EMA50: $112,660) still act as the last line of structural defense before deeper correction (Fib 0.382: $107,427);
∴ The Oracle speaks: Observe in silence. Await the market’s verdict post - FOMC;
∴ The first candle after the Fed’s announcement will become the Seal of Direction;
∴ If price breaks with conviction and volume, we shall invoke the RITO of Strategic Range Recalibration to redefine tactical zones and thresholds.
⊢
⧉
· Cryptorvm Dominvs · MAGISTER ARCANVM · Vox Primordialis ·
⚜️ ⌬ - Silence precedes the next force. Structure is sacred - ⌬ ⚜️
⧉
⊢
✠
Ritvs Logicæ in Terræ Chaos;
Nihil Tumultvs. Nihil Vanitatis. Tantum Silentivm, Structvra et Exsecutio.
𓂀 Vbi Volatilitas Disciplinam Tangit - Ibi Sto.
⩘ Porta Solum Aperitur Stantibvs in Silentio.
✠
Ritvs Logicæ in Terræ Chaos;
Nihil Tumultvs. Nihil Vanitatis. Tantum Silentivm, Structvra et Exsecutio.
𓂀 Vbi Volatilitas Disciplinam Tangit - Ibi Sto.
⩘ Porta Solum Aperitur Stantibvs in Silentio.
✠
Related publications
Disclaimer
The information and publications are not meant to be, and do not constitute, financial, investment, trading, or other types of advice or recommendations supplied or endorsed by TradingView. Read more in the Terms of Use.
✠
Ritvs Logicæ in Terræ Chaos;
Nihil Tumultvs. Nihil Vanitatis. Tantum Silentivm, Structvra et Exsecutio.
𓂀 Vbi Volatilitas Disciplinam Tangit - Ibi Sto.
⩘ Porta Solum Aperitur Stantibvs in Silentio.
✠
Ritvs Logicæ in Terræ Chaos;
Nihil Tumultvs. Nihil Vanitatis. Tantum Silentivm, Structvra et Exsecutio.
𓂀 Vbi Volatilitas Disciplinam Tangit - Ibi Sto.
⩘ Porta Solum Aperitur Stantibvs in Silentio.
✠
Related publications
Disclaimer
The information and publications are not meant to be, and do not constitute, financial, investment, trading, or other types of advice or recommendations supplied or endorsed by TradingView. Read more in the Terms of Use.