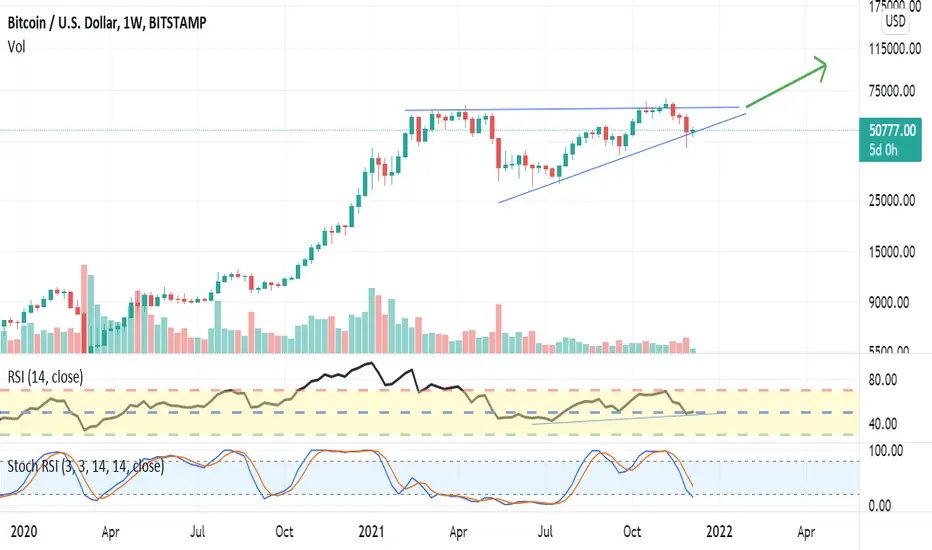
CRYPTO - BTC - Ascending triangle on weekly chart. The markets appear to be on edge. The ETH chart is not ready yet. But BTC has an ascending triangle which is a higher probability trade.
Volume - Falling like you see in an ascending triangle or bull flag. Which is good.
RSI - new RSI high on last price high. RSI lows are setting new highs showing weakness in selling.
STO is bottoming out indicating a bounce is due.
Target 1 = 89K
STOP = 46K
Volume - Falling like you see in an ascending triangle or bull flag. Which is good.
RSI - new RSI high on last price high. RSI lows are setting new highs showing weakness in selling.
STO is bottoming out indicating a bounce is due.
Target 1 = 89K
STOP = 46K
Disclaimer
The information and publications are not meant to be, and do not constitute, financial, investment, trading, or other types of advice or recommendations supplied or endorsed by TradingView. Read more in the Terms of Use.
Disclaimer
The information and publications are not meant to be, and do not constitute, financial, investment, trading, or other types of advice or recommendations supplied or endorsed by TradingView. Read more in the Terms of Use.