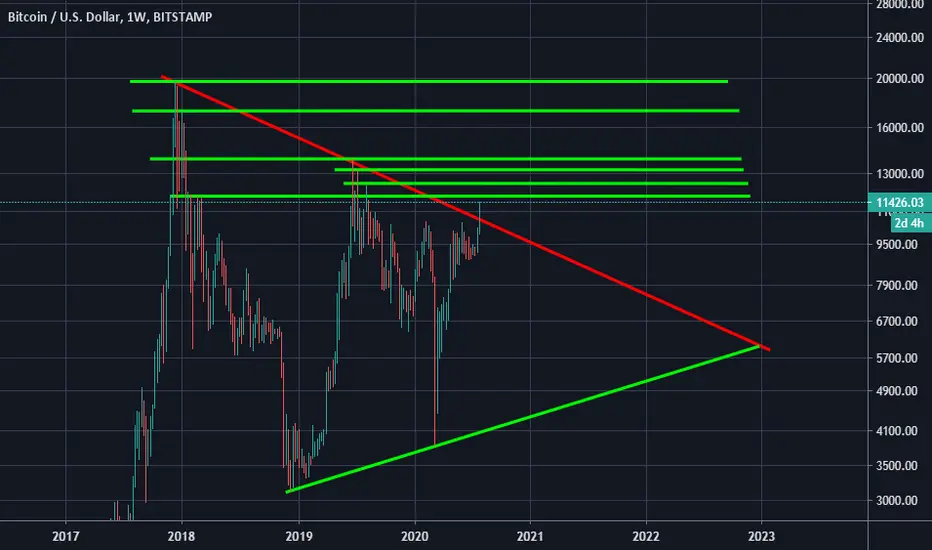
Back in August 2019 i first posted a chart explaining that bitcoin was in a Symmertrical Triangle, and now about 1 Year Later we finally broke out and now there are several areas of resistance to look out for: 11.7K, 12.4K, 13.4K, 13.8K, 17.1K & the top of the previous ATH @ 19.4-20K (depending on the exchange)
Disclaimer
The information and publications are not meant to be, and do not constitute, financial, investment, trading, or other types of advice or recommendations supplied or endorsed by TradingView. Read more in the Terms of Use.
Disclaimer
The information and publications are not meant to be, and do not constitute, financial, investment, trading, or other types of advice or recommendations supplied or endorsed by TradingView. Read more in the Terms of Use.