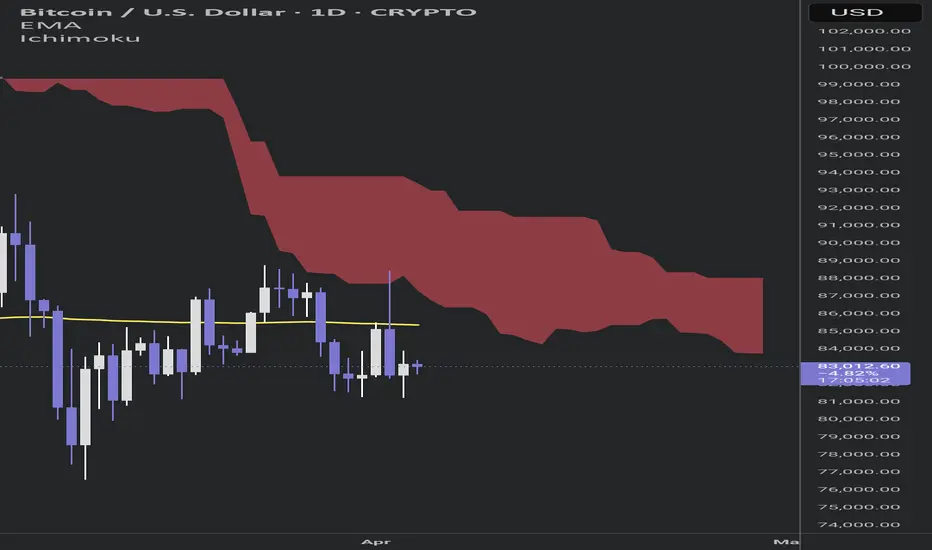
1. 200-Day Moving Average (Yellow Line):
The current Bitcoin price is below this moving average, indicating a bearish trend or weakness in upward momentum.
Typically, when the price is below the MA200, it acts as resistance, increasing the likelihood of further declines.
2. Ichimoku Indicator:
The red cloud in the future suggests a bearish outlook and may act as strong resistance.
The price is currently near the Ichimoku cloud, which indicates market indecision.
3. Price Candles:
The candles have not been able to establish a clear position above the MA200.
If the price fails to stabilize above $84,000, a drop to the $80,000–$78,000 range is likely.
If the MA200 resistance is broken, the price could rise toward $88,000.
Conclusion:
Based on the current data, the overall trend remains bearish or neutral unless the price successfully stabilizes above the MA200. Otherwise, a decline toward the $80,000 level is probable.
Best Regards
Disclaimer
The information and publications are not meant to be, and do not constitute, financial, investment, trading, or other types of advice or recommendations supplied or endorsed by TradingView. Read more in the Terms of Use.
Disclaimer
The information and publications are not meant to be, and do not constitute, financial, investment, trading, or other types of advice or recommendations supplied or endorsed by TradingView. Read more in the Terms of Use.