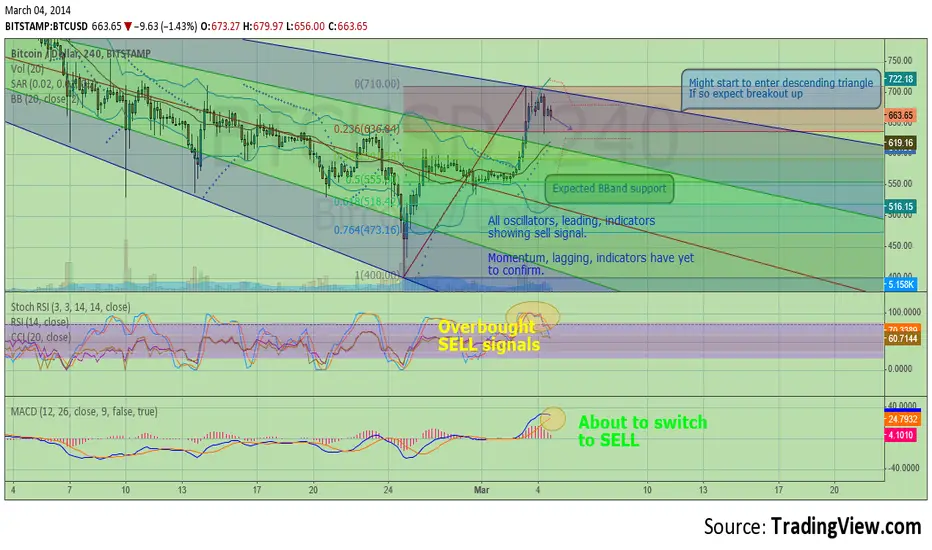
To make sense of all these colors we shall look at the some past history. The highest of the highs back in January 06, 2014 started the downward trend. The trend broke in February when the long term Fibonacci retracement (not shown) hit the lowest level.
Now BBands are rather easy to predict that the we are going to fall back onto them. Funny fact I happened to draw that arrow before I made that Fibonacci Retracement. Anyhow, a fall back is the best possible scenario as the bulls are taking a break before they pick up momentum. 590 would be the lowest level I would consider before I would consider that the bears have one.
For the short term I am bearish. The coming days looks like it will fall back to 636 retracement levels. Would not be surprised if we started entering another sideways market.
This is just the start of the accumulation phase expected to last for about 27 days.
Disclaimer
The information and publications are not meant to be, and do not constitute, financial, investment, trading, or other types of advice or recommendations supplied or endorsed by TradingView. Read more in the Terms of Use.
Disclaimer
The information and publications are not meant to be, and do not constitute, financial, investment, trading, or other types of advice or recommendations supplied or endorsed by TradingView. Read more in the Terms of Use.