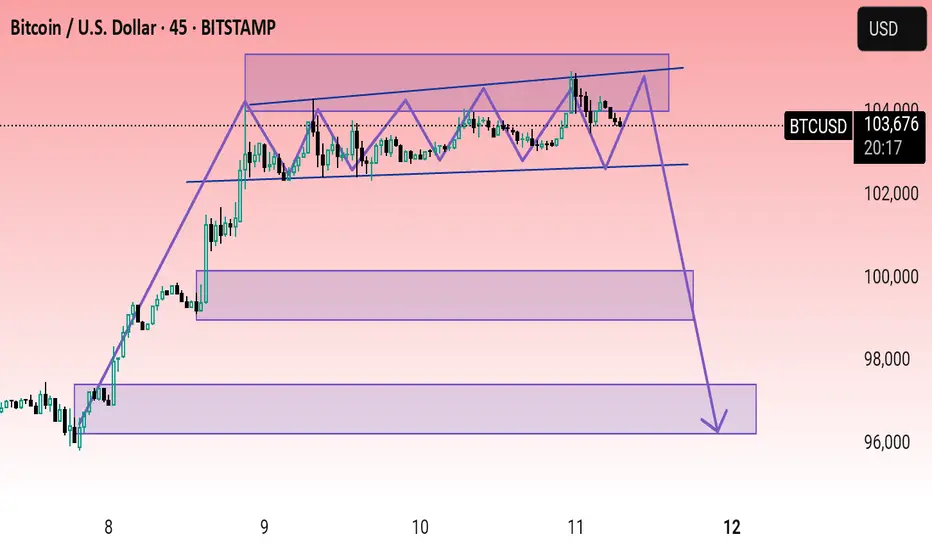
This chart shows the Bitcoin (BTC/USD) trading pair on a 45-minute timeframe from the BITSTAMP exchange. It appears to be a technical analysis chart predicting a potential bearish breakout from a consolidation pattern.
Here are the key details and interpretations:
1. Current Price: $103,667 (as of the chart timestamp).
2. Price Action:
BTC has been trading inside a rising wedge or channel (marked in purple).
A series of lower highs and higher lows indicate consolidation and decreasing momentum.
The breakout to the downside suggests bearish pressure.
3. Bearish Target Zones:
The chart includes three horizontal purple rectangles marking potential support zones:
Around 100,000 USD
Around 98,000 USD
Final target near 96,000 USD
A long downward arrow suggests a forecasted move toward these lower support levels.
4. Pattern & Strategy:
The purple zigzag lines show the price fluctuation within the pattern.
A possible descending move is anticipated after the breakdown from the wedge/channel.
This suggests a bearish short-term outlook unless BTC regains and holds above the upper boundary of the channel.
Would you like help identifying possible entry/exit points or risk management tips based on this chart?
Disclaimer
The information and publications are not meant to be, and do not constitute, financial, investment, trading, or other types of advice or recommendations supplied or endorsed by TradingView. Read more in the Terms of Use.
Disclaimer
The information and publications are not meant to be, and do not constitute, financial, investment, trading, or other types of advice or recommendations supplied or endorsed by TradingView. Read more in the Terms of Use.