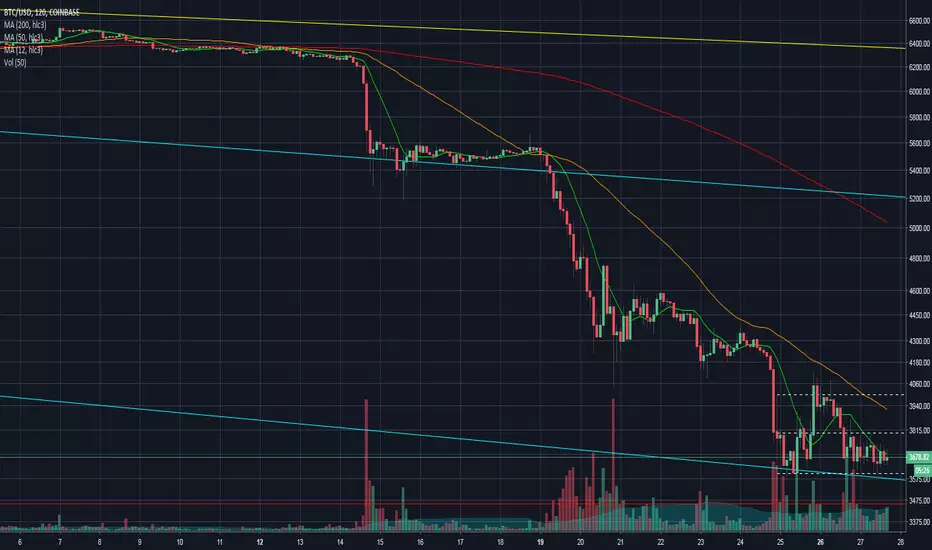
2Hr chart of CBP.
After rolling off the $6.2K table, BTC stablized at $5.5K for about 4 days, then rolled off that table to $4.2K-$4.4K for about 4 days, then rolled off the table again. The 100 Hr SMA (orange line) is pretty straight and down.
We've been bouncing around between $3.6K and $4.0K (with the exception of the wick to $3456.78) for a little less than 3 days. The 200W SMA is about $3133. If it doesn't roll off the table again in the next 1-2 days, it might mean something.
Disclaimer
The information and publications are not meant to be, and do not constitute, financial, investment, trading, or other types of advice or recommendations supplied or endorsed by TradingView. Read more in the Terms of Use.
Disclaimer
The information and publications are not meant to be, and do not constitute, financial, investment, trading, or other types of advice or recommendations supplied or endorsed by TradingView. Read more in the Terms of Use.