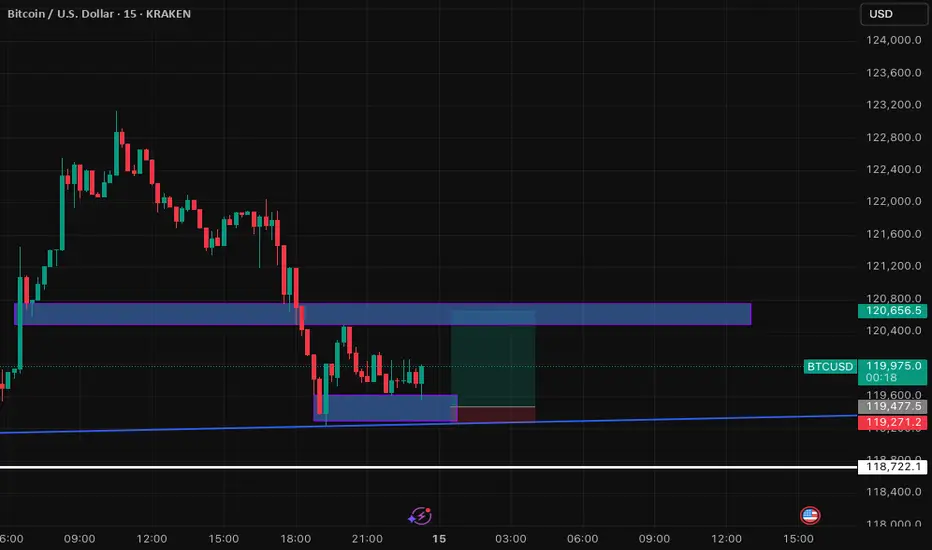
This 15-minute chart for BTC/USD highlights a potential reversal opportunity following a significant downtrend. Price has found support at a confluence of a rising long-term trendline and a defined demand zone around 119,271 - 119,477.5. The analysis focuses on the current consolidation at this support, looking for bullish candlestick patterns to confirm a move towards retesting the prior breakdown level (now resistance) at 120,500 - 120,700. Key observations include the breakdown from a previous support, the current bounce, and the defined risk-reward setup for a potential long entry."
Trade closed: target reached
We hit targer and re entred sell Disclaimer
The information and publications are not meant to be, and do not constitute, financial, investment, trading, or other types of advice or recommendations supplied or endorsed by TradingView. Read more in the Terms of Use.
Disclaimer
The information and publications are not meant to be, and do not constitute, financial, investment, trading, or other types of advice or recommendations supplied or endorsed by TradingView. Read more in the Terms of Use.