📊 Overview:
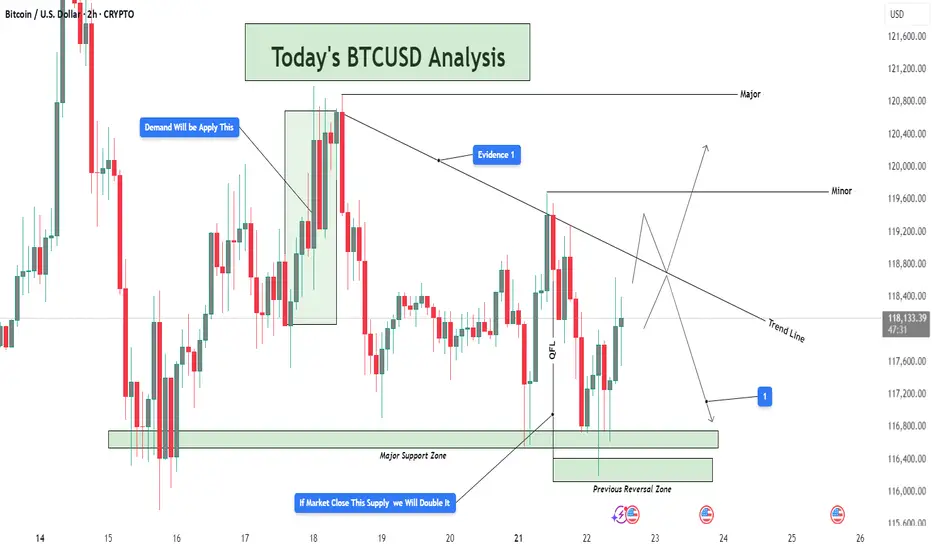
This BTCUSD 2-hour chart is giving us a clear structure of how price is currently reacting between a strong demand base and a descending trendline supply. We're at a critical decision point, where both buyers and sellers are gearing up for a potential breakout or breakdown. Let’s break it down level by level.
🟢 Demand Zone – Major Support Holding Firm
The Major Support Zone marked at the bottom of the chart is not just any random area—it has been tested multiple times and acted as a launchpad for bullish moves previously. This is also aligned with the Previous Reversal Zone, which adds confluence to this demand base.
Price dipped into this zone and immediately rejected with strong bullish candles, showing aggressive buyer interest.
This is a high-probability area for long setups as long as price stays above it.
You’ve noted on the chart: “If market closes this supply, we will double it” – that makes sense because a confirmed hold above this base increases the probability of upside continuation.
🔻 Trendline & Supply Zone – The Wall Ahead
Moving up the chart, price is being pressured by a descending trendline, acting as dynamic resistance. This trendline is not just drawn for decoration—it has rejected price at least twice already, and is also intersecting with a minor horizontal resistance zone.
This creates a confluence of resistance, making it a tough wall for buyers to break through without strong volume.
You’ve labeled it as “Evidence 1”, meaning the first confirmation of supply reacting here.
If BTC fails here again, we could easily see another pullback to the 116,800 – 116,400 range.
⚖️ QFL Pattern in Play
The QFL (Quick Flip Logic) is in action, where price aggressively dropped and formed a base, followed by a sharp move up. Price is now attempting to return to that base (demand zone) for a potential flip back upward.
If QFL holds and price breaks above the trendline, this will be a strong reversal confirmation.
This aligns with many institutional trading strategies which look for such formations near support zones.
📈 Potential Bullish Scenario:
Break above the descending trendline resistance
Price sustains above Minor Resistance Zone (around 118,800 – 119,600)
Next target: Major Resistance Zone between 120,800 – 121,200
This could create a higher-high structure and resume overall bullish trend
📉 Potential Bearish Scenario:
Failure to break the trendline
Rejection leads to price retesting the Major Support
If that zone breaks cleanly (especially below 116,400), price may drop toward 115,600 or lower
This opens up a possible short opportunity depending on price action and momentum
🎯 Conclusion:
This chart is a textbook example of consolidation between major zones. Bulls are defending hard at the bottom while bears are pushing down from the top. The direction of the breakout will dictate the next major move. Until then, wait for confirmation, avoid early entries, and let the market show its hand.
🧠 Patience = Profits.
🕒 Chart Timeframe: 2H
📌 Strategy in Focus: Supply & Demand Zones, Trendline Breakout, QFL Base Pattern
📍 Sentiment: Neutral-Bullish (Watching Trendline Reaction)
For Daily Trade Setups and Forecast: 📈 t.me/xauusdoptimizer
Premium Signals Fr33: 💯 t.me/xauusdoptimizer
🥰🥳🤩
Premium Signals Fr33: 💯 t.me/xauusdoptimizer
🥰🥳🤩
Related publications
Disclaimer
The information and publications are not meant to be, and do not constitute, financial, investment, trading, or other types of advice or recommendations supplied or endorsed by TradingView. Read more in the Terms of Use.