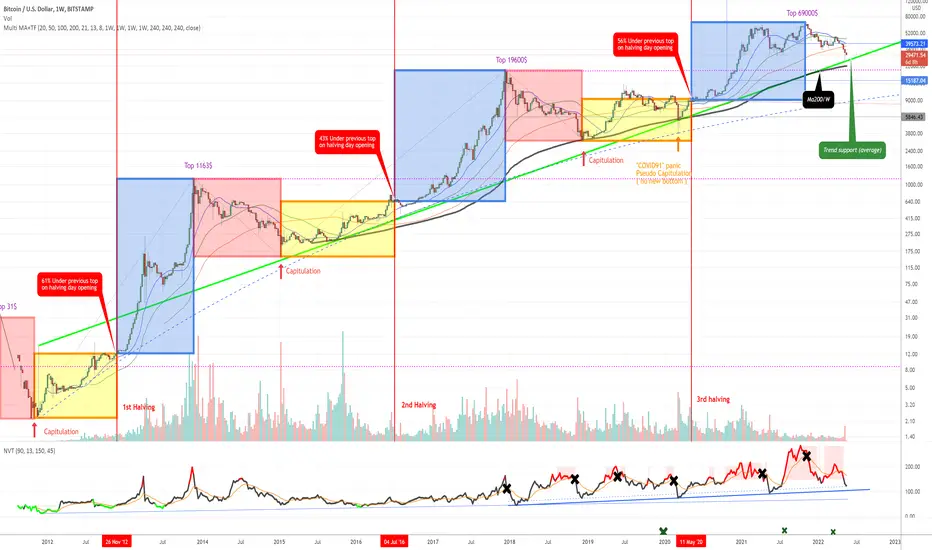
It was about time to refresh this one, dating back 2019 / 2020.
Still valid so far, close to green support.
I'm wondering about the outcome.
Previous iterations:
2020

2019

Still valid so far, close to green support.
I'm wondering about the outcome.
Previous iterations:
2020
2019
Note
CMF - 2Wpretty close to 2015,2018 bottom.
Willy - 2W
Pretty close to oversold, but not quite there.
NVT - W
Close to "landing" zone.
Hash Ribbons
Final capitulation ahead or not ? Let's decide ;)
All the above seems to suggest that either price will have a final move down soon, followed by a strong bounce, or a bounce with happen soon, with a further low being painted within the weeks after that (if so there's a chance of a higher low or double bottom).
Keep an eye on hash ribbons.
Trend reversal usually needs to go through miners capitulation.
Note
Miners capitulation started.Note
NVT entering the support area.Willy nearing oversold
CMF almost, but not quite there ...
All in all good R:R ratio for filling bids on weakness, especially in alts.
imho.
Note
Longer term let's look at TD count on MONTHLY.Usually 5th red candle sets bottom.
We have a decent 6th (may) and we're sitting on log support.
From here it's either confirm history, or write a new history.
Note
So let's see june close.Note
Weekly finally getting oversold.Note
Here we go on CMF as well:Make it or break it (mind it's 2W).
Note
CMF (W)Note
Finally NVT(W) intraweek infraction:Note
Dominance: the trap and the movement down towards support (43ish):Disclaimer
The information and publications are not meant to be, and do not constitute, financial, investment, trading, or other types of advice or recommendations supplied or endorsed by TradingView. Read more in the Terms of Use.
Disclaimer
The information and publications are not meant to be, and do not constitute, financial, investment, trading, or other types of advice or recommendations supplied or endorsed by TradingView. Read more in the Terms of Use.