Technical Analysis – BTCUSD Chart
Today we target Bitcoin in our weekly analysis:
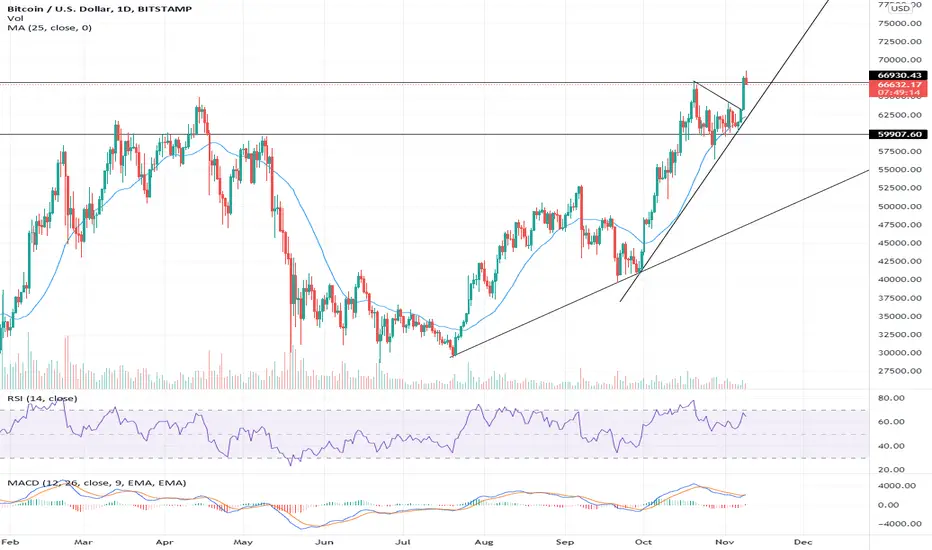
In our previous analysis on Bitcoin, we stated that Bitcoin could retrace to 52k USD and still be bullish, but the most bullish scenario would be holding 60k and continuing to the upside. The price managed to hold the 60k USD line and formed a triangle that was broken to the upside.
Usually, triangles signal a continuation move (to the up-or downside) within this case a confirmed break-out to the upside leading to a leg up that could look similar to the leg that started at the 40k USD level.
We have entered a price discovery phase with the MACD crossing and turning green just after the bullish triangle break-out. RSI is not even in the overbought zone which means we could reach much higher levels before we see any significant pullback.
The entire cryptocurrency market cap is touching the 3 trillion USD level given by the most recent upside move that resulted from a breakthrough in the resistance at 2.5 trillion USD, the all-time-high from March 2021. Therefore, the total cryptocurrency market cap has entered the price discovery phase as well – a great time to be part of this space.
Today we target Bitcoin in our weekly analysis:
In our previous analysis on Bitcoin, we stated that Bitcoin could retrace to 52k USD and still be bullish, but the most bullish scenario would be holding 60k and continuing to the upside. The price managed to hold the 60k USD line and formed a triangle that was broken to the upside.
Usually, triangles signal a continuation move (to the up-or downside) within this case a confirmed break-out to the upside leading to a leg up that could look similar to the leg that started at the 40k USD level.
We have entered a price discovery phase with the MACD crossing and turning green just after the bullish triangle break-out. RSI is not even in the overbought zone which means we could reach much higher levels before we see any significant pullback.
The entire cryptocurrency market cap is touching the 3 trillion USD level given by the most recent upside move that resulted from a breakthrough in the resistance at 2.5 trillion USD, the all-time-high from March 2021. Therefore, the total cryptocurrency market cap has entered the price discovery phase as well – a great time to be part of this space.
Disclaimer
The information and publications are not meant to be, and do not constitute, financial, investment, trading, or other types of advice or recommendations supplied or endorsed by TradingView. Read more in the Terms of Use.
Disclaimer
The information and publications are not meant to be, and do not constitute, financial, investment, trading, or other types of advice or recommendations supplied or endorsed by TradingView. Read more in the Terms of Use.