⊣
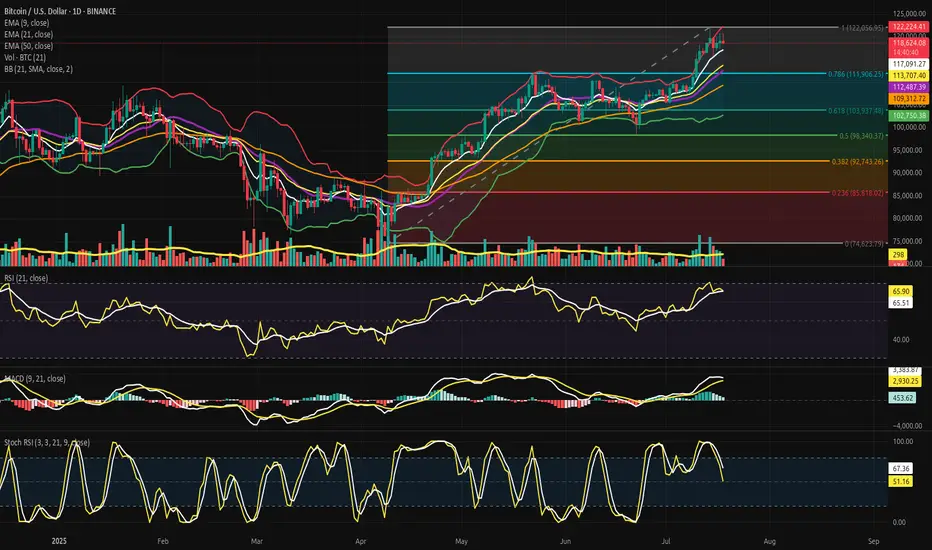
⟁ BTC/USD - BINANCE - (CHART: 1D) - (Jul 18, 2025).
◇ Analysis Price: $118,866.60.
⊣
⨀ I. Temporal Axis - Strategic Interval - (1D):
▦ EMA9 - (Exponential Moving Average - 9 Close):
∴ EMA9 is currently positioned at $119,077.81, closely tracking the current price, acting as dynamic micro-support;
∴ The slope of EMA9 remains upward, with price consistently closing above it in the past sessions;
∴ Compression candles are forming above this line, suggesting it is being defended as a tactical floor.
✴️ Conclusion: EMA9 is structurally supportive, signaling short-term bullish control beneath compression.
⊣
▦ EMA21 - (Exponential Moving Average - 21 Close):
∴ EMA21 is placed at $118,537.29 and holds a clear upward slope;
∴ Recent pullbacks have tested the region near EMA21 but failed to close beneath it;
∴ EMA21 is establishing itself as the primary mid-range buffer zone within this bullish phase.
✴️ Conclusion: EMA21 confirms intermediate momentum preservation and mid-term trend integrity.
⊢
▦ EMA50 - (Exponential Moving Average - 50 Close):
∴ EMA50 is located at $116,804.80 and remains untouched during the current rally phase;
∴ The distance between EMA21 and EMA50 is widening, confirming structural momentum;
∴ This line now functions as the lower tier of the bullish envelope - a defensive anchor.
✴️ Conclusion: EMA50 reflects resilient bullish understructure and rising support basin.
▦ Fibonacci Retracement - (ATH = $122,056.95 / Low = $74,623.79):
∴ Price is currently positioned just under the 0.786 level, a classic tension zone before ATH retests;
∴ The 0.618 level has already been claimed and held as support, showing strength through key retracements;
∴ The market is coiling between 0.786 and 1.000 in preparation for decisive expansion or rejection.
✴️ Conclusion: BTC sits within the golden gate - structurally pressurized near final resistance thresholds.
⊢
▦ Bollinger Bands:
∴ Bands are visibly contracting, forming a volatility funnel around the current price zone;
∴ The price is maintaining proximity to the upper band without closing beyond it;
∴ The base band remains far beneath ($116k zone), indicating untriggered potential.
✴️ Conclusion: Volatility is compressing structurally; directional resolution is imminent.
⊢
▦ Volume + EMA21:
∴ Volume bars have declined steadily during this upper-range consolidation;
∴ EMA21 on volume confirms weakening participation relative to early July moves;
∴ Absence of breakout-volume suggests either stealth accumulation or passive stalling.
✴️ Conclusion: Volume behavior is non-confirmatory - the structure floats without conviction.
⊢
▦ RSI - (21) + EMA9:
∴ RSI(21) currently prints 60.45, above its own EMA9 at 59.41, suggesting net upward pressure;
∴ The RSI slope remains neutral-to-positive without entering overbought;
∴ The absence of bearish divergence confirms internal momentum coherence.
✴️ Conclusion: RSI structure is clean, moderate, and aligned with sustainable trend energy.
⊢
▦ Stochastic RSI - (3,3,21,9):
∴ K = 78.78 | D = 71.55 - both above 70, nearing the overbought ceiling;
∴ The fast line (K) shows minor inflection but no confirmed cross;
∴ Momentum is elevated, but historical context shows price can remain extended.
✴️ Conclusion: Momentum is entering saturation zone - caution on short-term exhaustion.
⊢
▦ MACD - (9,21):
∴ MACD line (540.52) remains above the signal line (414.93) in sustained bullish crossover;
∴ The histogram has begun flattening, indicating reduced acceleration;
∴ There is no bearish cross yet, but momentum build is slowing.
✴️ Conclusion: MACD supports bullish continuation, but thrust intensity is decaying.
⊢
▦ OBV + EMA9:
∴ OBV reads 71.13M and is currently flat, with no new highs in accumulation;
∴ EMA9 on OBV closely hugs the raw OBV line, confirming stagnation;
∴ Prior upward surges in OBV are not being extended, showing tactical pause in conviction.
✴️ Conclusion: Liquidity expansion has halted; OBV structure is tactically neutral.
⊢
🜎 Strategic Insight - Technical Oracle:
∴ The BTC/USD structure is entering a compressed apex between structural momentum (EMA stack, RSI, MACD) and tactical exhaustion signals (Stochastic RSI, Bollinger Band constriction, flattening OBV);
∴ Price is stabilizing just beneath the ATH gate ($122,056), indicating a threshold scenario - where breakout and rejection probabilities are approaching parity;
∴ Volume decline reflects the absence of forced participation, and suggests that the next move will be event-triggered or liquidity-engineered. The current environment favors volatility re-expansion, not trend reversal;
✴️ This is a threshold phase: structurally bullish, tactically suspended, awaiting ignition.
⊢
∫ II. On-Chain Intelligence – (Source: CryptoQuant):
▦ Exchange Netflow Total + EMA9:
∴ Current Netflow: -938 Bitcoins - sustained negative flow over time indicates coins leaving exchanges;
∴ Persistent outflows reflect holding sentiment and reduced immediate sell pressure;
∴ Price action shows historical upside alignment when netflows remain negative across clusters.
✴️ Conclusion: Exchange behavior signals macro holding bias, not liquidation cycles.
⊢
▦ Binary CDD + EMA9:
∴ Binary CDD has spiked into high activity zones in the past week, showing awakened dormant coins;
∴ This metric historically precedes localized tops when synchronized with weak flows;
∴ However, no consistent clusters are forming - signals remain scattered.
✴️ Conclusion: Binary CDD reflects isolated movements, not systemic awakening or distribution.
⊢
▦ Exchange Whale Ratio + EMA9:
∴ Current ratio hovers at ~0.62 - elevated but not extreme;
∴ Sustained whale activity near 0.60+ can precede volatility events;
∴ Trendline is rising since May, showing gradual uptick in dominance from top senders.
✴️ Conclusion: Whale activity is tactically elevated, implying latent strategic intent.
⊢
▦ Supply-Adjusted Dormancy + EMA9:
∴ Dormancy values are near historical lows, indicating old coins are staying inactive;
∴ EMA9 confirms a downward trend in dormant supply movement;
∴ Long-term holders are not distributing at this level.
✴️ Conclusion: Structural dormancy supports holder conviction - no exit signals from old supply.
⊢
▦ Realized Cap + EMA9:
∴ Realized Cap is now exceeding $1T, rising consistently without parabolic spikes;
∴ EMA(9) and line are in lockstep - a healthy ascent;
∴ No acceleration = no blow-off = sustainable revaluation.
✴️ Conclusion: Value accumulation remains organic, not euphoric.
⊢
▦ MVRV Ratio + EMA9:
∴ MVRV sits at 2.36 - below historical overvaluation levels (>3.0);
∴ EMA(9) confirms gradual slope upward, consistent with price;
∴ Ratio is not overheated - risk/reward remains structurally favorable.
✴️ Conclusion: MVRV indicates non-euphoric regime - mid-phase of value appreciation.
⊢
▦ BTC vs GOLD vs S&P500 - (BGemetrix Comparative Graph):
∴ BTC continues to outperform both GOLD and SPX in long-term slope, even after corrections;
∴ Current phase shows GOLD flattening and SPX slightly lagging BTC in verticality;
∴ This divergence hints at BTC leading in speculative rotation while traditional assets stabilize.
✴️ Conclusion: BTC holds macro-dominance position, operating as the apex volatility proxy in current intermarket structure.
⊢
🜎 Strategic Insight - On-Chain Oracle:
∴ Despite short-term compression, the on-chain structure reveals no distribution threats;
∴ Holder conviction, realized valuation, and MVRV slope all suggest controlled structural appreciation, not mania;
∴ Whales are tactically present, but dormancy and exchange flows confirm no mass exit;
∴ This is an internally coherent, tactically patient regime.
✴️ Bitcoin is preparing, not peaking.
⊢
𓂀 Stoic-Structural Interpretation:
▦ Structurally Bullish - Tactically Suspended:
∴ All key EMA's (9/21/50) are stacked and rising; price remains elevated yet non-parabolic;
∴ Fibonacci apex is active, with price compressing beneath the ATH zone ($122,056), not retreating;
∴ On-chain intelligence confirms long-term conviction, with no distribution from whales or dormants.
✴️ Conclusion: The system retains structural strength; pressure is latent, not expired. The architecture is bullish, not euphoric.
⊢
▦ Tactical Range Caution:
∴ Stochastic RSI and MACD show early-stage exhaustion;
∴ Volume has declined into apex, favoring liquidity traps or volatility bursts;
∴ Whale Ratio elevation implies pre-positioning behavior, not public confirmation.
✴️ Conclusion: Tactical maneuvering is dominant. Breakout potential exists but is not trustable until confirmed by volume and displacement.
⊢
⧉
Cryptorvm Dominvs · ⚜️ MAGISTER ARCANVM ⚜️ · Vox Primordialis
⌬ - Wisdom begins in silence. Precision unfolds in strategy - ⌬
⧉
⊢
Trade active
⊣⟁ BTC/USD - BINANCE - (CHART: 1D) - (July 18, 2025):
⊣
⨀ I. Temporal Axis - Strategic Interval - (1D):
Corrected indicators below:
▦ RSI - (21) + EMA9:
∴ RSI = 66.97 | EMA9(RSI) = 65.72 - both climbing;
∴ RSI is closer to overbought zone than in the H4 view;
∴ No divergence is present, but proximity to resistance warrants caution.
✴️ Conclusion: RSI remains structurally sound, with slight tension emerging near upper bounds.
⊢
▦ MACD - (9,21):
∴ MACD Line = 3,431.11 | Signal Line = 2,939.70 - strong bullish gap persists;
∴ Histogram is rising, unlike the flat pattern in the H4 chart;
∴ Structural momentum is intact and increasing.
✴️ Conclusion: MACD shows reinforced bullish thrust from the base - momentum remains intact.
⊢
▦ Stochastic RSI - (3,3,21,9):
∴ K = 58.47 | D = 69.80 - both lines now crossing downward, exiting overbought;
∴ This descending structure is clearer on the 1D chart, marking a momentum slowdown;
∴ The D > K crossover confirms loss of short-term thrust.
✴️ Conclusion: Tactical momentum is clearly fading - structure holds, but impulse is weakening.
⊢
✠
Ritvs Logicæ in Terræ Chaos;
Nihil Tumultvs. Nihil Vanitatis. Tantum Silentivm, Structvra et Exsecutio.
𓂀 Vbi Volatilitas Disciplinam Tangit - Ibi Sto.
⩘ Porta Solum Aperitur Stantibvs in Silentio.
✠
Ritvs Logicæ in Terræ Chaos;
Nihil Tumultvs. Nihil Vanitatis. Tantum Silentivm, Structvra et Exsecutio.
𓂀 Vbi Volatilitas Disciplinam Tangit - Ibi Sto.
⩘ Porta Solum Aperitur Stantibvs in Silentio.
✠
Related publications
Disclaimer
The information and publications are not meant to be, and do not constitute, financial, investment, trading, or other types of advice or recommendations supplied or endorsed by TradingView. Read more in the Terms of Use.
✠
Ritvs Logicæ in Terræ Chaos;
Nihil Tumultvs. Nihil Vanitatis. Tantum Silentivm, Structvra et Exsecutio.
𓂀 Vbi Volatilitas Disciplinam Tangit - Ibi Sto.
⩘ Porta Solum Aperitur Stantibvs in Silentio.
✠
Ritvs Logicæ in Terræ Chaos;
Nihil Tumultvs. Nihil Vanitatis. Tantum Silentivm, Structvra et Exsecutio.
𓂀 Vbi Volatilitas Disciplinam Tangit - Ibi Sto.
⩘ Porta Solum Aperitur Stantibvs in Silentio.
✠
Related publications
Disclaimer
The information and publications are not meant to be, and do not constitute, financial, investment, trading, or other types of advice or recommendations supplied or endorsed by TradingView. Read more in the Terms of Use.