https://www.tradingview.com/x/ddq4ZlDH/
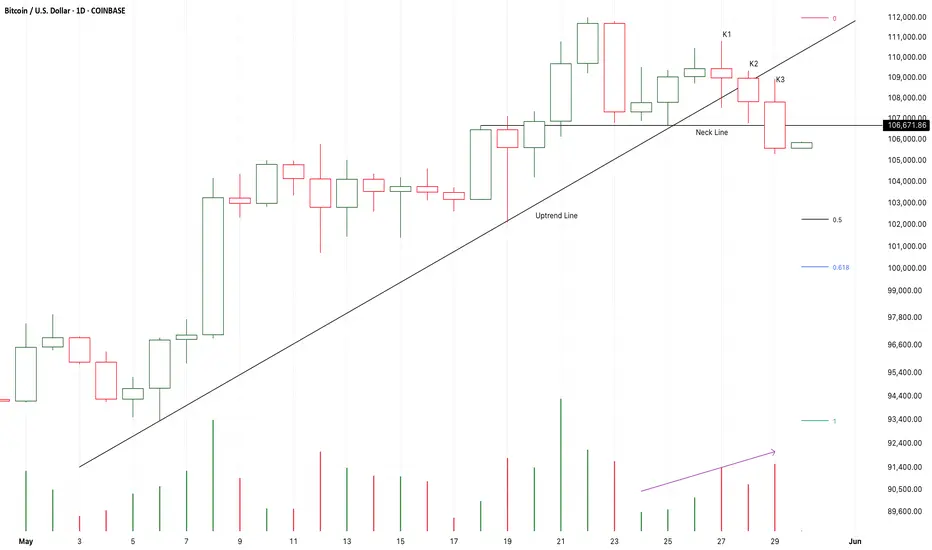
From K1 to K3,
It is a three soldiers advancing pattern,
It close below the uptrend line and the neck line of a potential double top pattern.
It seems that a short-term bear run will fall to test 102K area.
I will try to buy it there if the following candles couldn’t close below 0.618fib line.
On the other hand,
If K4 return back upon the neck line immediately,
K3 will be a fake down and the following candles will keep climbing up to test 112K area.
Short-106318/Stop-107318/Target-102188
Note
K6 is a weak candle under low volume,
And also,It failed to close upon the resistance to verify the bullish momentum of K5.
It seems that a larger scale consolidation is here.
If K7 fall to test 0.382fib line,
I will try to buy it at about 98K area.
On the other hand,
If K7 start with a bull gap and accelerate to break up the resistance,
The strong bull market is still possibly to come back.
Note
K5 close upon the resistance under sharply increased volume,
K6 verified that K5 was possibly a fake up candle.
If K7 start with a bear gap and accelerate to break down K4,
The market will verify the effectiveness of the resistance.
And a short-term consolidation or a price correction will start here.
The potential support at about 91-96K area.
I will try to buy it there.
On the other hand,
K6 failed to close below K5,
If K7 close upon K6,
That will verify a valid break up of K5.
And another bull run will start here.
Note
K2 to K4 verified a potential fake down of K0,
The support at 0.382-0.5fib area is really strong.
If K5 close upon K0,
Another bull run will start here to test 110K area.
On the other hand,
If K5 close below K3,
It is likely that the nearest short-term downtrend will expand down to accelerate to test 98K area.
Short-110.5K/Stop-111.5K/Target-98K
Long-104.1K/Stop-103.1K/Target-109.5K
Note
K1 break down the neck line,
But K2 failed to accelerate to verify the strong bullish momentum.
So, it is obviously that the short-term bear trend couldn’t lasts for a long time and fall deep.
If K2 return back upon the neck line,
A sharp rebound or another bull run will start here.
On the other hand,
K1 is also a first test to the potential support,
If there are more tests to verify the strength of the line,
Another bull run will start there.
I will try to buy it then.
Short-104108/Stop-105108/Target-98K
Long-97588/Stop-96588/Target-120K
Trade closed: stop reached
Disclaimer
The information and publications are not meant to be, and do not constitute, financial, investment, trading, or other types of advice or recommendations supplied or endorsed by TradingView. Read more in the Terms of Use.
Disclaimer
The information and publications are not meant to be, and do not constitute, financial, investment, trading, or other types of advice or recommendations supplied or endorsed by TradingView. Read more in the Terms of Use.