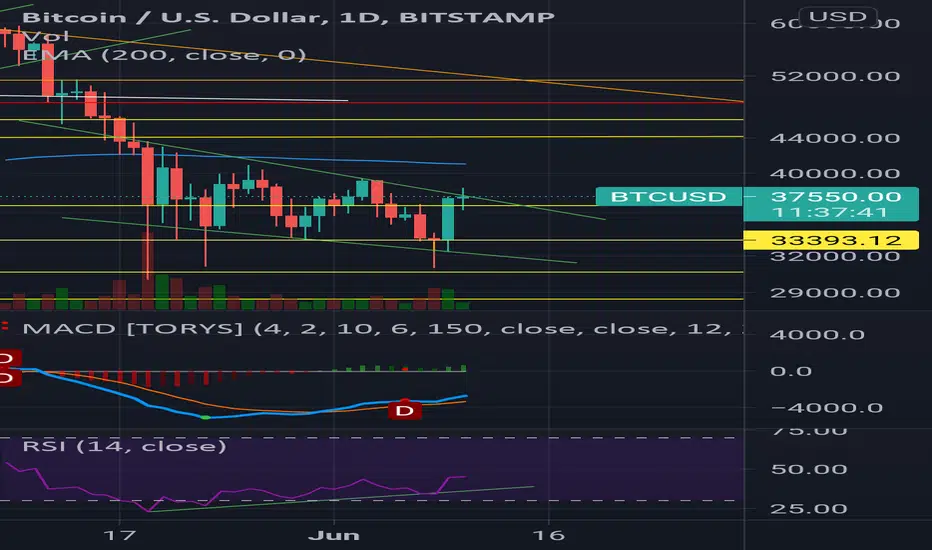
Seeing a couple of interesting things developing on the daily chart.
1. Falling wedge pattern. Most people have been focused on a bearish pennant setup. However, over the last few days I'm starting to see a falling wedge pattern showing up. A breakup from here would confirm.
2. Bullish divergence on RSI and MACD
3. Rising volume over the last couple of days.
I'm not suggesting a shot to the moon here. I could definitely see a sustained short term rally take place to the mid 40's. We have a lot of ground to cover before reaching new ATHs. I think that the people calling for sub 20k are going a bit over the top with those calls. I still think we drop into the 20"s over the next couple of months, but I think bullish demand at those levels will keep use above 20k.
Not financial advice.
Disclaimer
The information and publications are not meant to be, and do not constitute, financial, investment, trading, or other types of advice or recommendations supplied or endorsed by TradingView. Read more in the Terms of Use.
Disclaimer
The information and publications are not meant to be, and do not constitute, financial, investment, trading, or other types of advice or recommendations supplied or endorsed by TradingView. Read more in the Terms of Use.