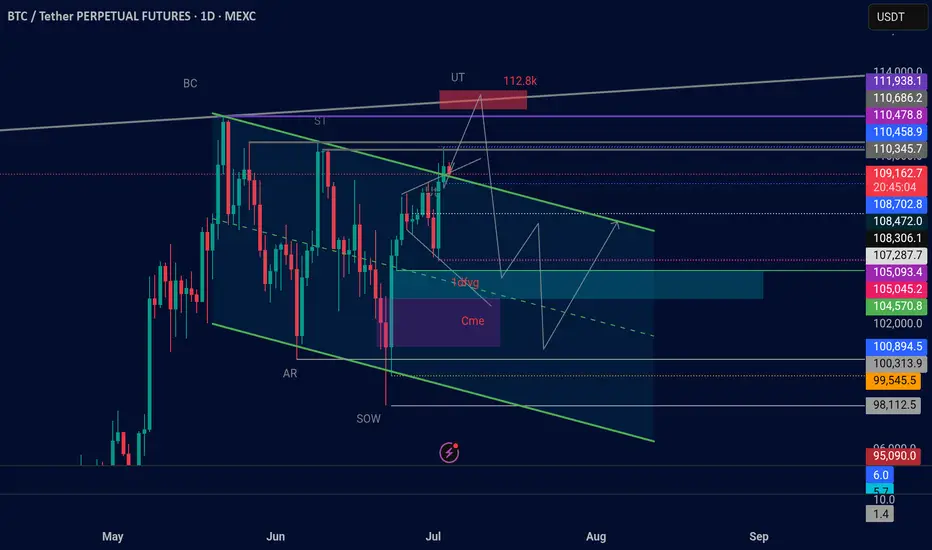
Based on the Wyckoff distribution methodology, the current chart suggests an upward trajectory, considering the presence of unfilled CME and FVG gaps. The anticipated scenario involves a continuation of the UT phase, potentially reaching targets around 112k/113k, followed by a correction towards the CME gap at approximately 102.5k.
Subsequently, a continuation into the UTA phase is expected, which may indicate the conclusion of the bull market.
Subsequently, a continuation into the UTA phase is expected, which may indicate the conclusion of the bull market.
Disclaimer
The information and publications are not meant to be, and do not constitute, financial, investment, trading, or other types of advice or recommendations supplied or endorsed by TradingView. Read more in the Terms of Use.
Disclaimer
The information and publications are not meant to be, and do not constitute, financial, investment, trading, or other types of advice or recommendations supplied or endorsed by TradingView. Read more in the Terms of Use.