BTC - Distribution Confirmed After Accumulation Cycle Completion
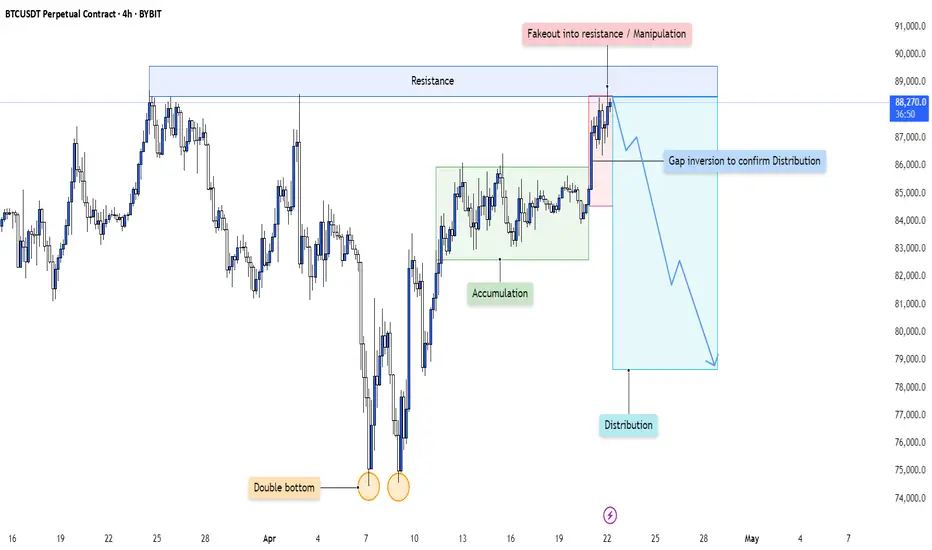
This 4H chart is a textbook illustration of how smart money cycles play out over time—starting with accumulation, leading into a sharp markup, and culminating in a deceptive distribution phase characterized by manipulation and false breakouts.
Let’s dissect each stage of this engineered move:
---
1. Accumulation Phase Following a Double Bottom
At the left of the chart, price forms a clear double bottom—a classic retail reversal signal.
- Smart money likely used this area to absorb sell-side liquidity, building long positions while retail traders expected further downside.
- This base formation set the foundation for the upcoming accumulation range, marked by sideways price action and multiple rejections from both highs and lows of the range.
The purpose of accumulation is simple: transfer supply from weak hands to strong hands. Every dip in this range allowed large players to fill bids without driving price too aggressively.
---
2. Sharp Markup and Resistance Interaction
Once positions were fully loaded, price launched into a strong impulsive move upward, confirming the transition from accumulation to markup.
- The move stalled at a clear horizontal resistance zone—marked as an area of prior supply and potential seller re-engagement.
- Price consolidated just below this resistance, building tension and liquidity in the form of breakout longs and stop orders from early shorts.
This led to the final stage of the cycle: distribution via manipulation.
---
3. Manipulation Above Resistance: The Fakeout
What followed was a classic fakeout above resistance.
- Price briefly broke above the key resistance area, attracting breakout buyers who assumed the trend would continue.
- In reality, this move served as a liquidity sweep and exit trap, allowing institutions to offload long positions accumulated earlier.
- The immediate rejection from this fakeout confirms a bull trap—a hallmark of distribution.
This is where smart money transitions from buyers to sellers while retail is left holding the bag.
---
4. Gap Inversion: Confirmation of Distribution
Post-fakeout, price creates a gap and immediately inverts back into the prior range, invalidating the breakout and forming a clear distribution schematic.
- The gap acts as a volume void or inefficiency, often revisited in reversal models.
- Once this area is rejected and price fails to reclaim the resistance zone, it becomes clear that distribution has been finalized.
- This breakdown marks the beginning of a markdown phase—typically faster and more violent than the markup.
The rejection confirms that price is now being delivered to the downside.
---
5. Narrative: From Accumulation to Redistribution and Collapse
This setup isn’t random—it’s narrative-driven:
- Double Bottom → Accumulation → Breakout → Manipulation → Distribution → Reversal
Each phase builds on the previous one, guided by smart money's intent to trap liquidity and maximize profit during transitions.
Now that distribution is confirmed, the expectation is continued downward delivery as price seeks out untapped liquidity and rebalances imbalances left behind during the markup.
---
Conclusion:
This 4H structure is a clear representation of the Wyckoff distribution model in action:
- Accumulation fuels markup.
- Breakout entices buyers.
- Manipulation traps them.
- Distribution unloads supply.
- Reversal completes the cycle.
The move down is not a random pullback—it is the deliberate continuation of a planned liquidity cycle. Expect further downside unless this structure is invalidated with a reclaim and break of the prior fakeout zone.
Order cancelled
Didnt make the IFVG so didnt took itMY LINKS
📈 Free Signals
bit.ly/3YxiRXr
💬 Discord Community
bit.ly/4jHHA3O
💵 Favorite Exchange
bit.ly/4lBeTXt
📈 Free Signals
bit.ly/3YxiRXr
💬 Discord Community
bit.ly/4jHHA3O
💵 Favorite Exchange
bit.ly/4lBeTXt
Disclaimer
The information and publications are not meant to be, and do not constitute, financial, investment, trading, or other types of advice or recommendations supplied or endorsed by TradingView. Read more in the Terms of Use.
MY LINKS
📈 Free Signals
bit.ly/3YxiRXr
💬 Discord Community
bit.ly/4jHHA3O
💵 Favorite Exchange
bit.ly/4lBeTXt
📈 Free Signals
bit.ly/3YxiRXr
💬 Discord Community
bit.ly/4jHHA3O
💵 Favorite Exchange
bit.ly/4lBeTXt
Disclaimer
The information and publications are not meant to be, and do not constitute, financial, investment, trading, or other types of advice or recommendations supplied or endorsed by TradingView. Read more in the Terms of Use.