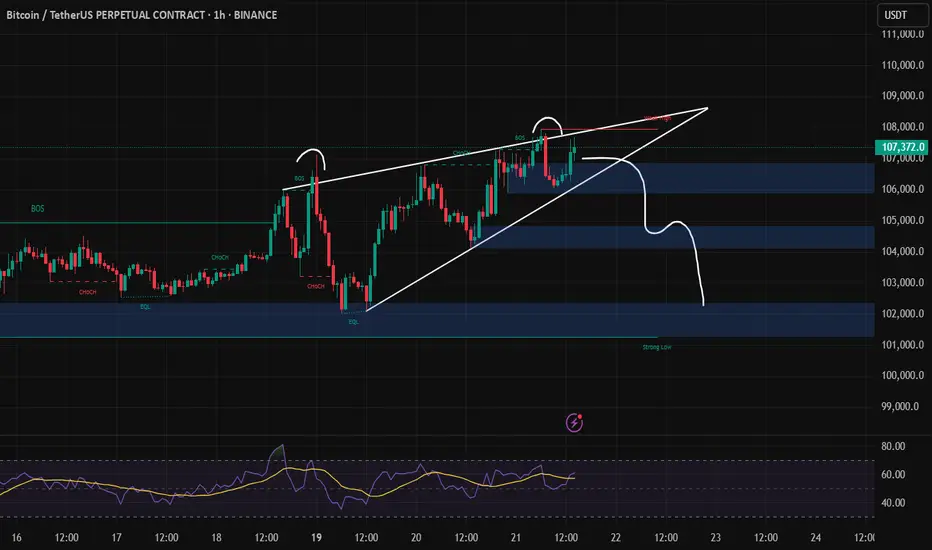
Key Technical Elements
1. Rising Wedge Pattern
The price is currently at the top of a rising wedge, a bearish reversal pattern.
Wedge resistance is being respected.
A fakeout (or deviation) above resistance seems to have occurred, implying exhaustion from buyers.
2. Double Top / Lower High Formation
Two swing highs are marked with rounded tops.
These can act as a liquidity grab or distribution pattern, followed by a sell-off.
3. BOS (Break of Structure) and CHoCH (Change of Character)
The chart shows multiple BOS and CHoCHs indicating shifts in momentum.
The most recent CHoCH suggests bearish momentum reappearing after a BOS.
4. Liquidity Zones / Demand Blocks
Several demand zones are marked (blue boxes), and the path drawn suggests they may be swept.
The target seems to be near the “Strong Low” region (~$102K), a major support level and liquidity zone.
5. RSI Bearish Divergence
RSI shows a lower high while price made a higher high, a common bearish divergence.
Suggests weakening bullish momentum.
Disclaimer
The information and publications are not meant to be, and do not constitute, financial, investment, trading, or other types of advice or recommendations supplied or endorsed by TradingView. Read more in the Terms of Use.
Disclaimer
The information and publications are not meant to be, and do not constitute, financial, investment, trading, or other types of advice or recommendations supplied or endorsed by TradingView. Read more in the Terms of Use.