Btc harmonics chart.
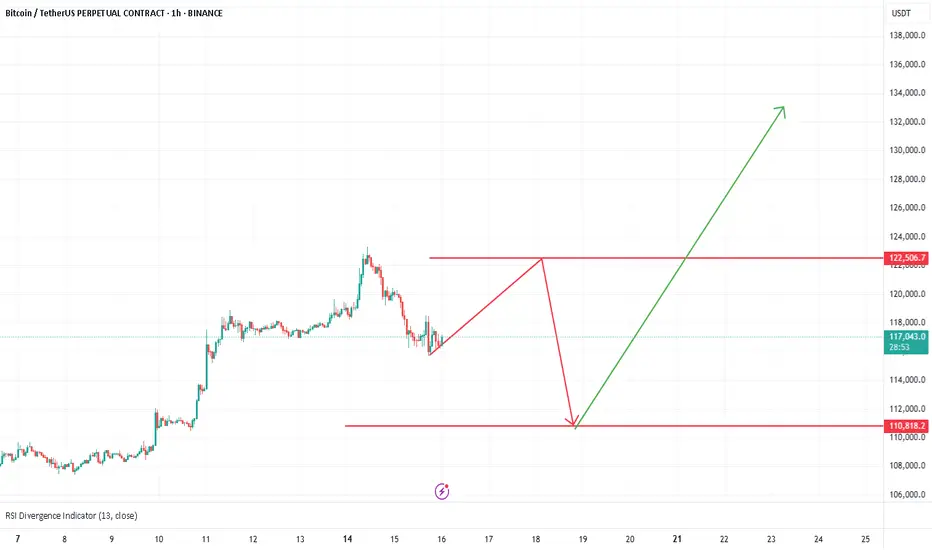
Price should go up to hit 122k to form a bearish pattern, if the pattern will not get invalidated the target area is around 100k - 98k, and that will form a bullish harmonics pattern that will push the price to 132 - 137k and above, if 100k will hold support.
Price should go up to hit 122k to form a bearish pattern, if the pattern will not get invalidated the target area is around 100k - 98k, and that will form a bullish harmonics pattern that will push the price to 132 - 137k and above, if 100k will hold support.
Disclaimer
The information and publications are not meant to be, and do not constitute, financial, investment, trading, or other types of advice or recommendations supplied or endorsed by TradingView. Read more in the Terms of Use.
Disclaimer
The information and publications are not meant to be, and do not constitute, financial, investment, trading, or other types of advice or recommendations supplied or endorsed by TradingView. Read more in the Terms of Use.