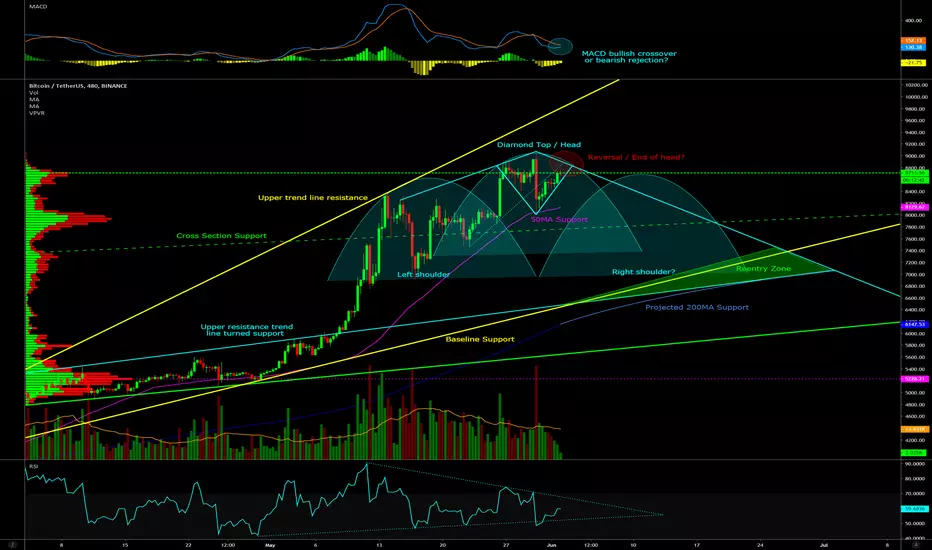
The chart is pretty self explanatory.
Note
I forgot to note the declining volume and that the RSI has pierced the lower trend line. This indicates the RSI not likely to break above the upper trend line and is more likely to break below the bottom trend line again.Disclaimer
The information and publications are not meant to be, and do not constitute, financial, investment, trading, or other types of advice or recommendations supplied or endorsed by TradingView. Read more in the Terms of Use.
Disclaimer
The information and publications are not meant to be, and do not constitute, financial, investment, trading, or other types of advice or recommendations supplied or endorsed by TradingView. Read more in the Terms of Use.