👋 Welcome to TradeCity Pro!
Let’s dive into today’s analysis of Bitcoin and key crypto indices. As usual, I’ll walk you through the futures session triggers for the New York session.
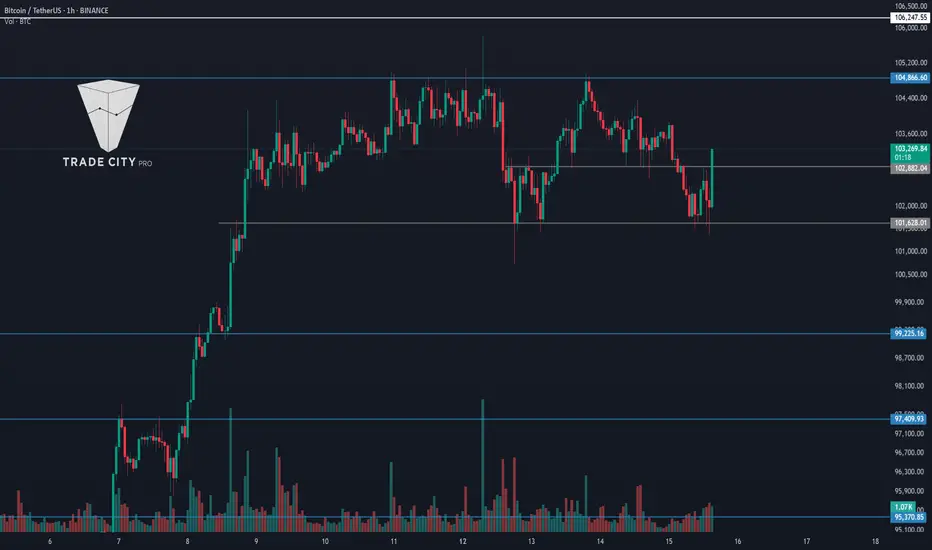
⌛️ 1-Hour Timeframe
As you can see in the 1-hour timeframe, the price has broken below the 102886 support and dropped to 101628, where it found support and is now making its way back toward the 102886 level.
✨ If the 102886 level is broken again, we could open a long position targeting the main recent high of the market at 104886.
🌩 The 104886 zone is a very significant level, and breaking it could initiate the next bullish leg for Bitcoin. However, the all-time high resistance at 106247 remains a solid barrier, forming a key supply zone between 104886 and 106247.
✔️ Since this zone is a major area of supply, it’s best to already be in a position before price reaches it. There’s a strong chance of a sharp move, and the breakout may not provide a clear confirmation candle, making it difficult to catch an entry in real time.
🔽 For short positions, our current trigger is the 101628 level. A breakdown here could begin a deeper correction. Key support levels to watch are 99225 and 97409.

👑 BTC.D Analysis
Moving on to Bitcoin dominance—yesterday, the trendline we had drawn was broken, and now dominance is heading toward 63.12.
🧩 The break of this trendline doesn’t indicate a trend reversal just yet. The bearish momentum in this current leg has been strong, and for a full reversal, we would need to see a higher high and higher low form on higher timeframes.
🔔 For now, the next corrective zones for dominance are at 63.61 and 64.10.

📅 Total2 Analysis
Let’s look at the Total2 index. Like Bitcoin, it has undergone a correction and has reached the 1.18 support level.
🎲 The current short trigger is the 1.18 level, and a breakdown here would confirm a deeper correction.
🔼 For long positions, the 1.24 and 1.26 levels are suitable triggers.

📅 USDT.D Analysis
Now let’s analyze Tether dominance. The index has corrected to the 4.69 level.
☘️ If 4.69 is broken, the market could undergo a deeper correction toward 4.82. On the other hand, if the price gets rejected from this level, the likelihood of a move back down to 4.51 increases.
❌ Disclaimer ❌
Trading futures is highly risky and dangerous. If you're not an expert, these triggers may not be suitable for you. You should first learn risk and capital management. You can also use the educational content from this channel.
Finally, these triggers reflect my personal opinions on price action, and the market may move completely against this analysis. So, do your own research before opening any position.
Let’s dive into today’s analysis of Bitcoin and key crypto indices. As usual, I’ll walk you through the futures session triggers for the New York session.
⌛️ 1-Hour Timeframe
As you can see in the 1-hour timeframe, the price has broken below the 102886 support and dropped to 101628, where it found support and is now making its way back toward the 102886 level.
✨ If the 102886 level is broken again, we could open a long position targeting the main recent high of the market at 104886.
🌩 The 104886 zone is a very significant level, and breaking it could initiate the next bullish leg for Bitcoin. However, the all-time high resistance at 106247 remains a solid barrier, forming a key supply zone between 104886 and 106247.
✔️ Since this zone is a major area of supply, it’s best to already be in a position before price reaches it. There’s a strong chance of a sharp move, and the breakout may not provide a clear confirmation candle, making it difficult to catch an entry in real time.
🔽 For short positions, our current trigger is the 101628 level. A breakdown here could begin a deeper correction. Key support levels to watch are 99225 and 97409.
👑 BTC.D Analysis
Moving on to Bitcoin dominance—yesterday, the trendline we had drawn was broken, and now dominance is heading toward 63.12.
🧩 The break of this trendline doesn’t indicate a trend reversal just yet. The bearish momentum in this current leg has been strong, and for a full reversal, we would need to see a higher high and higher low form on higher timeframes.
🔔 For now, the next corrective zones for dominance are at 63.61 and 64.10.
📅 Total2 Analysis
Let’s look at the Total2 index. Like Bitcoin, it has undergone a correction and has reached the 1.18 support level.
🎲 The current short trigger is the 1.18 level, and a breakdown here would confirm a deeper correction.
🔼 For long positions, the 1.24 and 1.26 levels are suitable triggers.
📅 USDT.D Analysis
Now let’s analyze Tether dominance. The index has corrected to the 4.69 level.
☘️ If 4.69 is broken, the market could undergo a deeper correction toward 4.82. On the other hand, if the price gets rejected from this level, the likelihood of a move back down to 4.51 increases.
❌ Disclaimer ❌
Trading futures is highly risky and dangerous. If you're not an expert, these triggers may not be suitable for you. You should first learn risk and capital management. You can also use the educational content from this channel.
Finally, these triggers reflect my personal opinions on price action, and the market may move completely against this analysis. So, do your own research before opening any position.
💥 Don’t Miss Out!
🏆 Best Crypto Exchange: bitunix.com/register?vipCode=TCPINT
💰 Join the Telegram Channel Now: t.me/Tradecityproint
🤵 Business Contact: Tradecityproteam@gmail.com
🏆 Best Crypto Exchange: bitunix.com/register?vipCode=TCPINT
💰 Join the Telegram Channel Now: t.me/Tradecityproint
🤵 Business Contact: Tradecityproteam@gmail.com
Related publications
Disclaimer
The information and publications are not meant to be, and do not constitute, financial, investment, trading, or other types of advice or recommendations supplied or endorsed by TradingView. Read more in the Terms of Use.