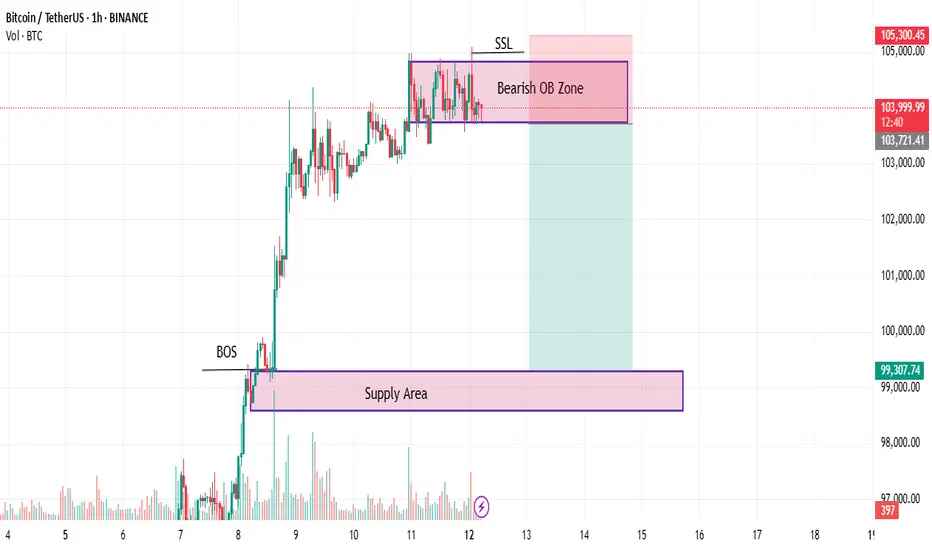
1. Bearish Order Block (OB) Zone:
The red rectangular area at the top marks a potential supply zone, indicating an area where selling pressure may emerge.
This zone suggests that sellers are likely to dominate if the price remains within or below it.
2. Supply Area:
The purple rectangular zone at the bottom represents a broader supply area, where previous selling interest was noted.
If the price drops to this level, it may encounter significant support or consolidation.
3. Break of Structure (BOS):
The BOS label marks a point where the price broke above a previous high, indicating a temporary bullish structure.
However, the subsequent consolidation in the Bearish OB Zone indicates that the bullish momentum might be weakening.
4. SSL (Sell Side Liquidity):
The SSL label points to a level where sell-side liquidity is present, suggesting that the market may have grabbed liquidity before reversing.
5. Risk and Reward Areas:
The green zone below represents the target (profit area) if the price moves downward from the OB zone.
The red zone above indicates the stop-loss area, signaling where the setup might be invalidated if the price breaks higher.
6. Volume Analysis:
The volume bars indicate relatively low activity, suggesting consolidation or indecision within the Bearish OB Zone.
Chart Status:
The chart indicates a potential bearish reversal from the Bearish OB Zone, aiming for the Supply Area below.
A break and close above the SSL would invalidate the bearish setup, while a rejection from the OB Zone could push the price lower.
Trade active
**1. Current Price Action:*** The price is currently **consolidating within the Bearish OB Zone**, indicating **indecision or a potential reversal point**.
* This zone acts as a **potential resistance**, where selling pressure may increase.
**2. Market Structure:**
* **Break of Structure (BOS):**
* The price previously broke above a significant level (marked as BOS), indicating a **bullish shift**.
* However, the failure to maintain upward momentum near the **SSL (Sell Side Liquidity)** suggests a **possible trap** or liquidity grab.
* **Supply Area:**
* The **lower purple zone** represents a key **support or demand area**, where price may find buyers if the bearish move materializes.
**3. Risk and Reward Zones:**
* **Red Zone (Stop-Loss Area):**
* Positioned above the Bearish OB Zone, indicating where the setup is invalidated if the price breaks higher.
* **Green Zone (Target Area):**
* Located below the consolidation, representing a **profit target** if the price moves downward as expected.
**4. Volume Analysis:**
* The volume shows **lower activity** during consolidation, which may indicate **weakening bullish momentum** or a buildup before a potential drop.
**5. Sentiment:**
* **Bearish Bias:**
* If the price gets rejected from the Bearish OB Zone, it could trigger a **downward move** toward the Supply Area.
* **Bullish Invalidity:**
* A **break and close above the SSL** would **invalidate the bearish outlook** and suggest continuation to the upside.
Trade closed: target reached
The setup appears to be progressing well, as the price is moving towards the target zone. After breaking down from the Bearish OB Zone, the price has shown consistent downward movement. The next key area to watch is the Supply Area near $99,300, where the price might find support or consolidate. Volume is moderately stable, indicating ongoing market interest in the downward move.I Will Sharing Personal Entries &How Trades.
All Of These For Free & I Will Not Take a Penny From Anyone .
So Please My Friends Trade On Your Own Risk
If You Guys Like My Ideas Then Follow Me And Comments Me .
All Of These For Free & I Will Not Take a Penny From Anyone .
So Please My Friends Trade On Your Own Risk
If You Guys Like My Ideas Then Follow Me And Comments Me .
Disclaimer
The information and publications are not meant to be, and do not constitute, financial, investment, trading, or other types of advice or recommendations supplied or endorsed by TradingView. Read more in the Terms of Use.
I Will Sharing Personal Entries &How Trades.
All Of These For Free & I Will Not Take a Penny From Anyone .
So Please My Friends Trade On Your Own Risk
If You Guys Like My Ideas Then Follow Me And Comments Me .
All Of These For Free & I Will Not Take a Penny From Anyone .
So Please My Friends Trade On Your Own Risk
If You Guys Like My Ideas Then Follow Me And Comments Me .
Disclaimer
The information and publications are not meant to be, and do not constitute, financial, investment, trading, or other types of advice or recommendations supplied or endorsed by TradingView. Read more in the Terms of Use.