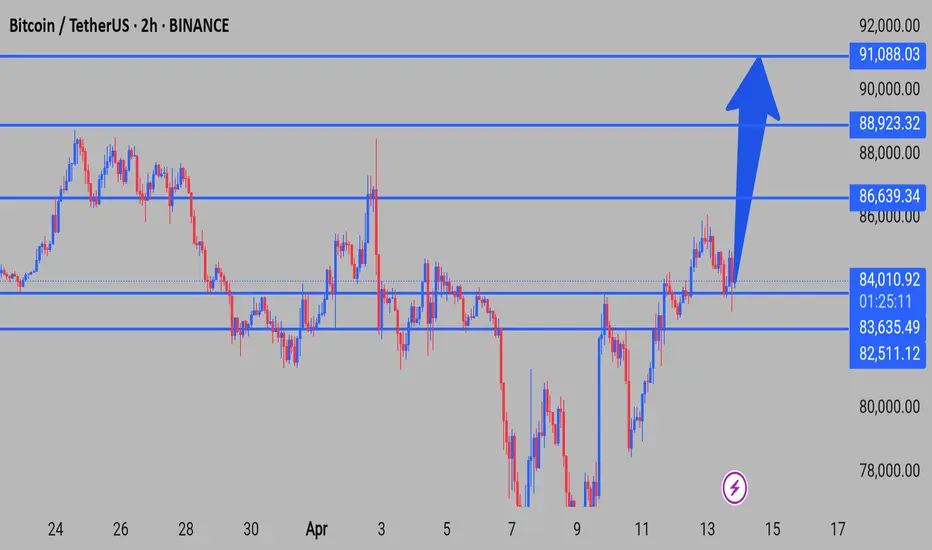
BTC/USDT has bounced from the support zone around 82,500–83,600 and is now trading near 84,000. If price holds above this zone, the next key resistance levels lie at 86,639, 88,923, and ultimately 91,088.
A strong bullish structure is forming on the 2-hour chart, and a breakout above 86,639 could accelerate upward momentum toward the 91K area.
The current price action suggests potential for continuation, but traders should keep an eye on volume and market sentiment for confirmation.
Note: This analysis is for educational purposes only. Always conduct your own research before trading.
Disclaimer
The information and publications are not meant to be, and do not constitute, financial, investment, trading, or other types of advice or recommendations supplied or endorsed by TradingView. Read more in the Terms of Use.
Disclaimer
The information and publications are not meant to be, and do not constitute, financial, investment, trading, or other types of advice or recommendations supplied or endorsed by TradingView. Read more in the Terms of Use.