Hello, traders.
If you "Follow", you can always get new information quickly.
Have a nice day today.
-------------------------------------
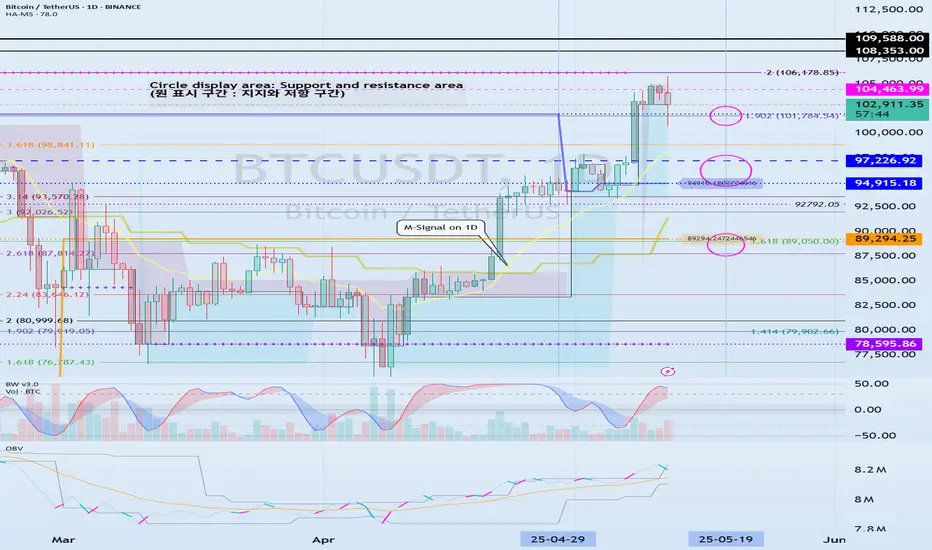
(BTCUSDT 1D chart)
It has touched the Fibonacci ratio 1.902 (101784.54) and is rising.
The key is whether it can receive support near the StochRSI 50 indicator (102971.99) and rise.
If not, it can fall to the 94915.18-97226.92 area.
Since the HA-Low indicator is formed at the 89294.25 point, it is important whether the price can be maintained above that point.
If the StochRSI indicator falls below the overbought range and then rises while moving sideways around the Fibonacci ratio range of 1.902 (101784.54) ~ 2 (106178.85), it is expected to renew the ATH.
Even if it falls more than expected, if it rises along the M-Signal indicator on the 1D chart, it is highly likely to renew the ATH.
----------------------------------------------------------
I will explain the newly added indicators, StochRSI 50, StochRSI 80, and StochRSI 20.
The disadvantage of interpreting the StochRSI indicator added as an auxiliary indicator is that it cannot determine the price movement.
Because of this, when interpreting the StochRSI indicator so far,
- Whether it is in the overbought or oversold zone,
- Whether StochRSI is above or below the 50 point,
we interpreted it as above.
Therefore, we added the price movement to the StochRSI indicator to check the movement more accurately.
-
The StochRSI 50 indicator is literally created when the StochRSI indicator passes the 50 point.
Therefore, we need to think about a response plan based on the price StochRSI 50 indicator.
-
The fact that StochRSI 80 is created means that the StochRSI indicator has risen above 80.
Therefore, in order to continue the upward trend, StochRSI must rise above 80.
If StochRSI 80 is not created and only StochRSI 20 is created, the upward trend will occur when the price is maintained above the StochRSI 50 indicator.
-
The fact that StochRSI 20 was created means that the StochRSI indicator has fallen below 20.
Therefore, in order to continue the downtrend, it must fall below StochRSI 20.
If StochRSI 20 is not created and only StochRSI 80 is created, the downtrend will occur when the price is maintained below the StochRSI 50 indicator.
-
Thank you for reading to the end.
I hope you have a successful trade.
--------------------------------------------------
- This is an explanation of the big picture.
I used TradingView's INDEX chart to check the entire range of BTC.
I rewrote the previous chart to update it by touching the Fibonacci ratio range of 1.902 (101875.70) ~ 2 (106275.10).
(Previous BTCUSD 12M chart)
Looking at the big picture, it seems to have been following a pattern since 2015.
In other words, it is a pattern that maintains a 3-year bull market and faces a 1-year bear market.
Accordingly, the bull market is expected to continue until 2025.
-
(Current BTCUSD 12M chart)
Based on the currently written Fibonacci ratio, it is displayed up to 3.618 (178910.15).
It is expected that it will not fall again below the Fibonacci ratio of 0.618 (44234.54).
(BTCUSDT 12M chart)
I think it is around 42283.58 when looking at the BTCUSDT chart.
-
I will explain it again with the BTCUSD chart.
The Fibonacci ratio ranges marked in the light green boxes, 1.902 (101875.70) ~ 2 (106275.10) and 3 (151166.97) ~ 3.14 (157451.83), are expected to be important support and resistance ranges.
In other words, it seems likely to act as a volume profile range.
Therefore, in order to break through this section upward, I think the point to watch is whether it can rise with support near the Fibonacci ratios of 1.618 (89126.41) and 2.618 (134018.28).
Therefore, the maximum rising section in 2025 is expected to be the 3 (151166.97) ~ 3.14 (157451.83) section.
To do that, we need to look at whether it can rise with support near 2.618 (134018.28).
If it falls after the bull market in 2025, we don't know how far it will fall, but considering the previous decline, we expect it to fall by about -60% to -70%.
So, if the decline starts near the Fibonacci ratio 3.14 (157451.83), it seems likely that it will fall to around Fibonacci 0.618 (44234.54).
I will explain more details when the downtrend starts.
------------------------------------------------------
Note
(BTCUSDT 1D chart)The HA-High indicator is showing signs of being created at the 102302.08 point.
Accordingly, if the HA-High indicator is created at the 102302.08 point, the key is whether there is support around that point.
(30m chart)
If it falls below the Fibonacci ratio of 1.902 (101784.54), it is expected to touch the M-Signal indicator on the 1D chart and determine the trend again.
Note
In order to continue the uptrend, the price must rise above StochRSI 80 (104984.57).
Currently, it is showing resistance near 104984.57, so caution is required when trading.
In particular, since the StochRSI indicator is showing a downward trend in the overbought zone, it is necessary to check whether it can be supported near the StochRSI 50 indicator.
If it is not supported, it is expected to correct the trend again by touching the M-Signal indicator on the 1D chart.
Trade active
#BTCUSDTHA-High indicator was formed at 102302.08.
Accordingly, the key is whether it can receive support and rise around this area.
Currently, the StochRSI indicator appears to have fallen below the midpoint.
Therefore, it is necessary to check where the StochRSI indicator is located when it turns upward.
If that point is near the HA-High indicator point, it is important to see whether there is support around that area.
If not, and it falls, it is expected to re-determine the trend by touching the M-Signal indicator on the 1D chart.
Note
(BTCUSDT 1D chart)After the M-Signal of the 1D chart > M-Signal of the 1W chart changed to
- located near the HA-High indicator,
- OBV indicator > OBV EMA line.
The charts below are charts that showed a similar appearance to the current appearance.
Not long after, it showed a downward trend below the HA-High indicator.
Accordingly, the key to this volatility period is whether there is support near the HA-High indicator after May 18-20.
When it fails to receive support and falls, if the OBV indicator < OBV EMA line, you should prepare for a decline.
However, it is not known whether this decline will immediately turn into a large downtrend.
In order to turn into a large downtrend, it is expected that it will be possible only if it shows a change from the M-Signal of the 1D chart < the M-Signal of the 1W chart.
Therefore, if it falls from the HA-High indicator,
1st: M-Signal of the 1D chart
2nd: M-Signal of the 1W chart
You should check for support near the M-Signal indicators corresponding to the 1st and 2nd above.
Therefore, if it creates a pull back pattern and rises, it is expected that it will be possible only if it shows a rise near the M-Signal indicator of the 1D chart or near 97226.92.
If the downtrend starts,
- You should check if the StochRSI indicator changes to StochRSI > StochRSI EMA,
- If the OBV indicator changes to OBV EMA line,
That is because it is more likely to show an uptrend again.
Other content (coins, stocks, etc.) is frequently posted on X.
X에 다른 내용(코인, 주식 등)이 자주 게시.
◆ t.me/readCryptoChannel
[HA-MS Indicator]
bit.ly/3YxHgvN
[OBV Indicator]
bit.ly/4dcyny3
X에 다른 내용(코인, 주식 등)이 자주 게시.
◆ t.me/readCryptoChannel
[HA-MS Indicator]
bit.ly/3YxHgvN
[OBV Indicator]
bit.ly/4dcyny3
Related publications
Disclaimer
The information and publications are not meant to be, and do not constitute, financial, investment, trading, or other types of advice or recommendations supplied or endorsed by TradingView. Read more in the Terms of Use.