📈 Technical Analysis (description for the post):
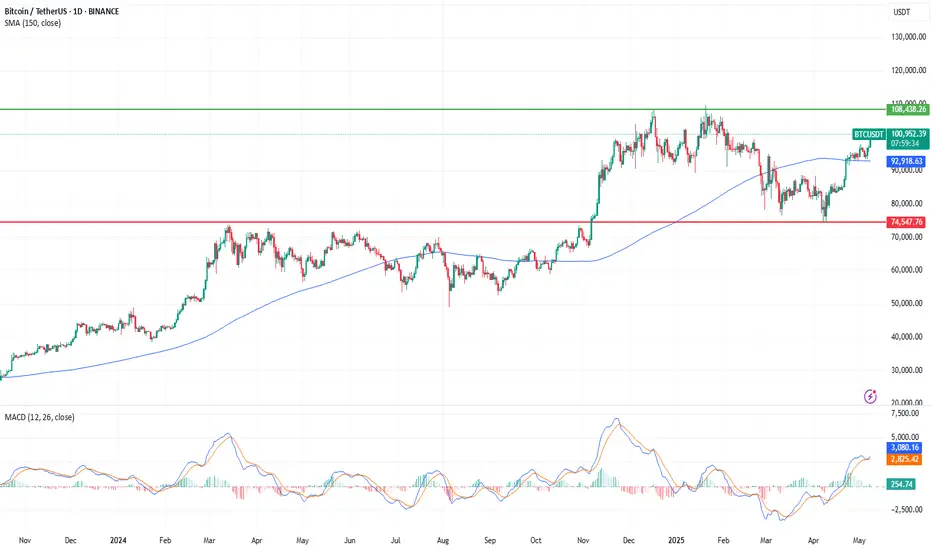
On the daily chart of BTC/USDT, we can see that the price is once again approaching the psychological and structural resistance around 108,000 USDT, a level that previously acted as a strong rejection zone. Currently, Bitcoin is trading above the 150-period simple moving average (SMA150), which reinforces a short- to mid-term bullish outlook.
The MACD indicator shows a clear bullish continuation signal, although already in high territory. This could suggest some short-term consolidation before a solid breakout. If BTC manages to break above the 108,000 USDT level with strong volume, it could open the path to all-time highs.
The most relevant support remains near 74,500 USDT, a key level that served as the base of the latest upward move. This structure allows for trading strategies with a favorable risk-reward ratio, especially for swing traders.
📌 This analysis is created using tools similar to those we integrate into our AI systems for traders. If you're interested in automating your strategy or implementing virtual assistants into your trading platform or customer service, learn more at:
Disclaimer
The information and publications are not meant to be, and do not constitute, financial, investment, trading, or other types of advice or recommendations supplied or endorsed by TradingView. Read more in the Terms of Use.
Disclaimer
The information and publications are not meant to be, and do not constitute, financial, investment, trading, or other types of advice or recommendations supplied or endorsed by TradingView. Read more in the Terms of Use.