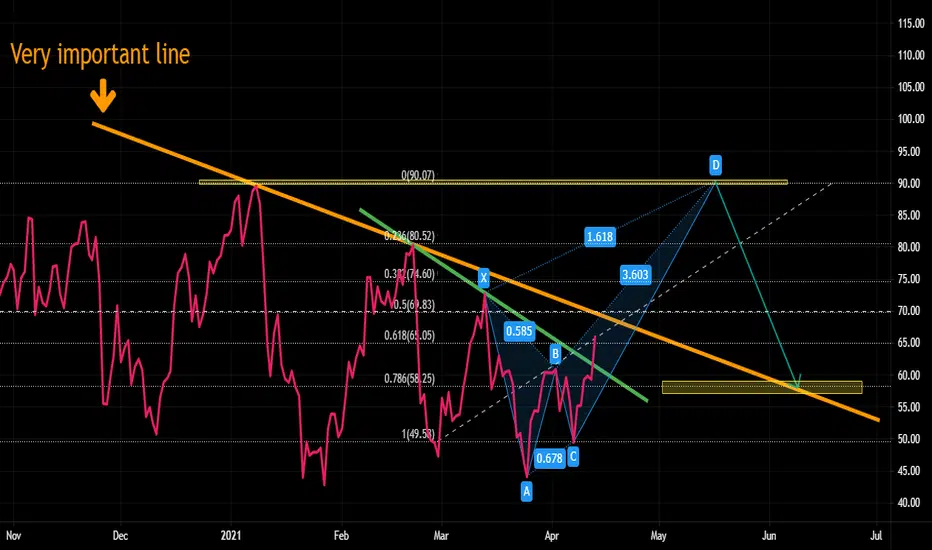
In the daily chart, an obvious divergence is visible. If Bitcoin breaks the important orange trend line (I emphasize the orange trend line is extremely important), it will break the daily divergence out and probably it will rise up in order to complete crab harmonic pattern (RSI level 90). And then, it might fall down to RSI level 58.
And yet, what will happen to Bitcoin price ?
I will illustrate that in my next post.
And yet, what will happen to Bitcoin price ?
I will illustrate that in my next post.
Disclaimer
The information and publications are not meant to be, and do not constitute, financial, investment, trading, or other types of advice or recommendations supplied or endorsed by TradingView. Read more in the Terms of Use.
Disclaimer
The information and publications are not meant to be, and do not constitute, financial, investment, trading, or other types of advice or recommendations supplied or endorsed by TradingView. Read more in the Terms of Use.
