### 🔥 **Bitcoin (BTCUSDT) Daily Chart Analysis – May 30, 2025**
**“Correction in Play or Deeper Dive Incoming?”**
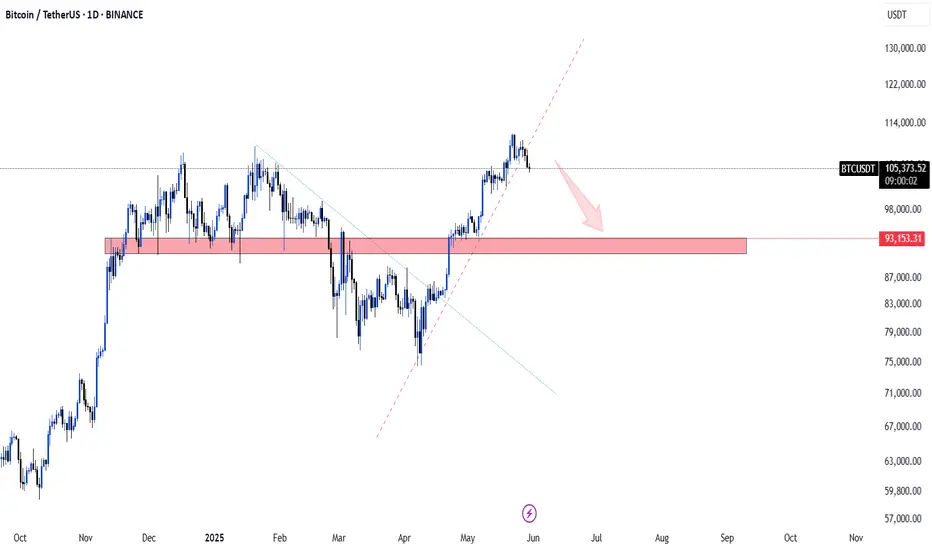
After a powerful breakout above the descending trendline, Bitcoin surged with momentum — but now the bulls are pausing for breath.
🔻 **Current Price Action:**
BTC is showing early signs of a **pullback**, rejecting near \$106K. The uptrend line (dashed pink) has been breached, signaling that we might be entering a **correction phase**.
🛡️ **Key Support Zone – \$90,000 to \$95,000:**
Highlighted in red, this zone acted as a **major resistance** in the past and is now likely to **flip into support**. It's a strong demand area — buyers are expected to step in here.
🔍 **What’s Next?**
A move down toward this support area looks probable in the short term (as indicated by the arrow). Price reaction in this zone will be **critical**:
* ✅ **If BTC holds this zone** and forms bullish reversal candles → we could see another **leg up**.
* ❌ **If this support breaks down**, BTC may revisit deeper levels — possibly around \$87K or lower.
---
### 📊 **Summary**
* **Trend:** Bullish with short-term correction
* **Support to Watch:** \$90K–\$95K
* **Resistance:** \$106K–\$108K
* **Strategy:** Wait for a bullish confirmation near the support zone. Patience is power.
---
📢 *Trade with logic, not emotions. The market rewards preparation – not prediction.*
Disclaimer
The information and publications are not meant to be, and do not constitute, financial, investment, trading, or other types of advice or recommendations supplied or endorsed by TradingView. Read more in the Terms of Use.
Disclaimer
The information and publications are not meant to be, and do not constitute, financial, investment, trading, or other types of advice or recommendations supplied or endorsed by TradingView. Read more in the Terms of Use.