📊 Chart Explanation: BTC/USDT (4H, Bybit)
🟢 Current Situation:
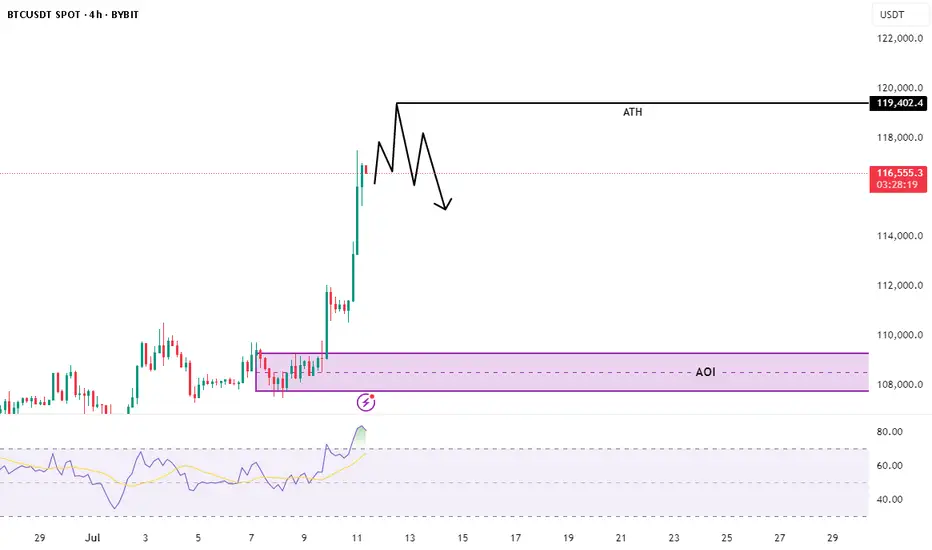
BTC is pushing toward its All-Time High (ATH) level at $119,402.
We've seen a strong vertical rally with minimal pullbacks — classic "euphoria phase" behavior.
Price is currently around $116,500, getting close to major resistance.
⚠️ Key Observation – Bearish Divergence:
The Relative Strength Index (RSI) is showing bearish divergence:
Price is making higher highs
RSI is making lower highs
This signals momentum weakening, despite price moving up — a possible reversal warning.
🚫 Why No Trade (Yet):
You're not entering a position now because:
Price is near ATH — a major liquidity area where fakeouts are common
You expect a potential rejection or liquidity sweep near ATH
No confirmed reversal or entry trigger yet
🟣 What You're Watching:
The AOI (Area of Interest) marked around $108,000–$110,000
This is likely a previous consolidation or demand zone
If price retraces and gives a clean setup (e.g., bullish structure, volume, RSI reset), then you may consider a long entry
🔍 Summary:
You're being patient and strategic, observing potential weakness in momentum . now 119.4k will be next ATH. In my point of view .
No trade now — waiting for confirmation or a pullback into your AOI zone.
👉 Follow me on X for real-time market updates & trade ideas! 👇
#BTC #Bitcoin #Crypto #Trading #TA #RSI #Divergence
🟢 Current Situation:
BTC is pushing toward its All-Time High (ATH) level at $119,402.
We've seen a strong vertical rally with minimal pullbacks — classic "euphoria phase" behavior.
Price is currently around $116,500, getting close to major resistance.
⚠️ Key Observation – Bearish Divergence:
The Relative Strength Index (RSI) is showing bearish divergence:
Price is making higher highs
RSI is making lower highs
This signals momentum weakening, despite price moving up — a possible reversal warning.
🚫 Why No Trade (Yet):
You're not entering a position now because:
Price is near ATH — a major liquidity area where fakeouts are common
You expect a potential rejection or liquidity sweep near ATH
No confirmed reversal or entry trigger yet
🟣 What You're Watching:
The AOI (Area of Interest) marked around $108,000–$110,000
This is likely a previous consolidation or demand zone
If price retraces and gives a clean setup (e.g., bullish structure, volume, RSI reset), then you may consider a long entry
🔍 Summary:
You're being patient and strategic, observing potential weakness in momentum . now 119.4k will be next ATH. In my point of view .
No trade now — waiting for confirmation or a pullback into your AOI zone.
👉 Follow me on X for real-time market updates & trade ideas! 👇
#BTC #Bitcoin #Crypto #Trading #TA #RSI #Divergence
Disclaimer
The information and publications are not meant to be, and do not constitute, financial, investment, trading, or other types of advice or recommendations supplied or endorsed by TradingView. Read more in the Terms of Use.
Disclaimer
The information and publications are not meant to be, and do not constitute, financial, investment, trading, or other types of advice or recommendations supplied or endorsed by TradingView. Read more in the Terms of Use.