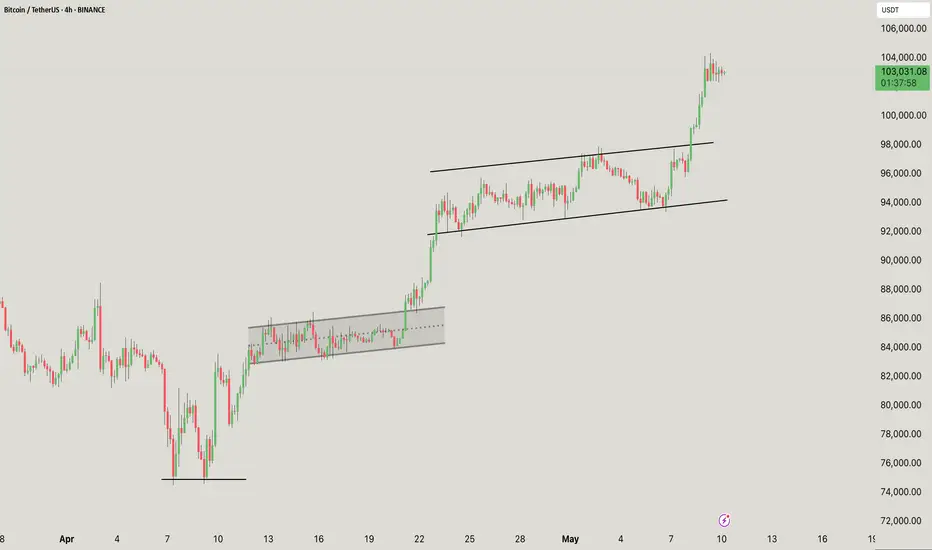
This chart shows classic bullish continuation through ascending channels and consolidation breakouts:
A solid double-bottom structure was formed in early April
Marked the start of the uptrend
First consolidation box (~$90K–$93K)
Horizontal accumulation (highlighted gray box)
Resulted in a clean breakout and continuation
Rising channel (~$94K–$99K)
Rising Mid-trend consolidation wedge/channel
Price respected both trendlines
Eventually broke out to the upside → Strong momentum candle followed
Current Status (~$103K)
Price has broken above the rising channel
Now forming a new mini flag or consolidation at the top
Momentum is still in favor of the bulls
If you found this analysis helpful, hit the Like button and share your thoughts or questions in the comments below. Your feedback matters!
Thanks for your support!
DYOR. NFA
Related publications
Disclaimer
The information and publications are not meant to be, and do not constitute, financial, investment, trading, or other types of advice or recommendations supplied or endorsed by TradingView. Read more in the Terms of Use.
Related publications
Disclaimer
The information and publications are not meant to be, and do not constitute, financial, investment, trading, or other types of advice or recommendations supplied or endorsed by TradingView. Read more in the Terms of Use.