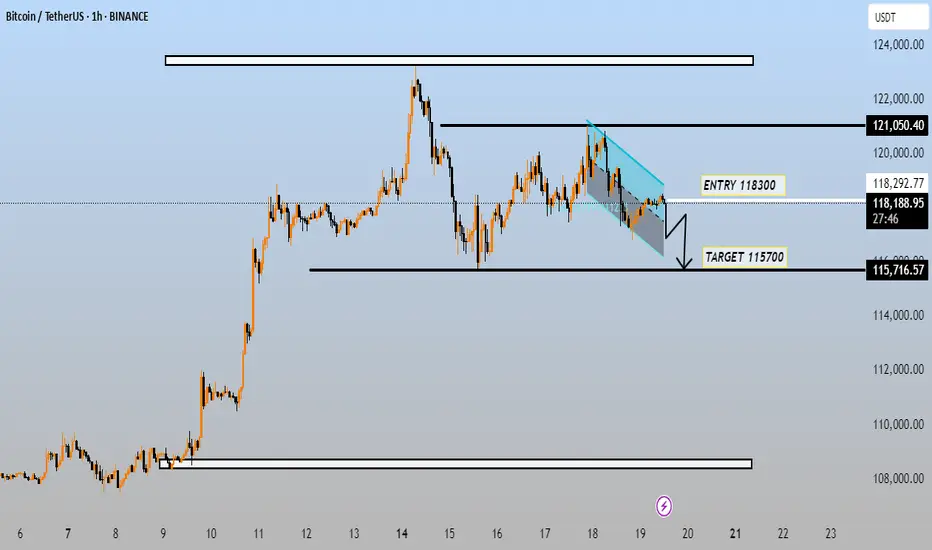
This chart shows a technical analysis of Bitcoin (BTC) / TetherUS (USDT) on a 1-hour timeframe from Binance, published on July 19, 2025.
Key Details:
Price at the time of chart: ~118,316 USDT
Bearish setup with a descending channel pattern highlighted in cyan.
Entry Level: 118,300 USDT (Short position)
Target: 115,700 USDT
Resistance zone: ~121,050 USDT
Support zone: ~115,716 USDT
Analysis Summary:
The chart suggests a potential short trade with a bearish breakout from the descending channel.
If price breaks below the channel support, the suggested move is short from 118,300 to 115,700, indicating a ~2.2% downside.
The target (115,700) aligns with a previous support zone from earlier in the chart, adding confluence.
The 121,050 level represents strong resistance from a previous high.
Interpretation:
This is a classic bear flag pattern forming after a significant down move from the recent peak. The trader expects a continuation to the downside once the pattern resolves.
Let me know if you want:
A trading plan based on this idea
Risk/reward analysis
Confirmation indicators to support this setup
Join telegram free...
t.me/+16bIVCNBo0MzYzk0
Forex Gold & Crypto Signals with
detailed analysis & get consistent |
result ...
Gold Signals with peoper TP & SL for
high profit ...
t.me/+16bIVCNBo0MzYzk0
t.me/+16bIVCNBo0MzYzk0
Forex Gold & Crypto Signals with
detailed analysis & get consistent |
result ...
Gold Signals with peoper TP & SL for
high profit ...
t.me/+16bIVCNBo0MzYzk0
Disclaimer
The information and publications are not meant to be, and do not constitute, financial, investment, trading, or other types of advice or recommendations supplied or endorsed by TradingView. Read more in the Terms of Use.