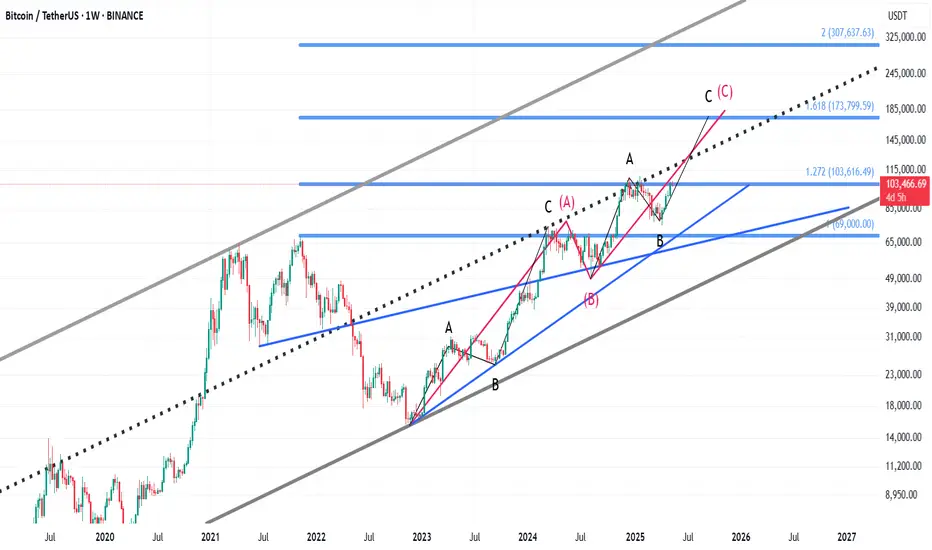
After crashing from its $69K peak (Nov 2021) to $15,476 (Nov 2022), Bitcoin has entered a bullish Elliott Wave structure, forming a classic 3-wave corrective pattern:
🔹 Wave A: Rally to $73,777 (with internal abc structure)
🔹 Wave B: Pullback to $49,000
🔹 Wave C: Currently unfolding — with a potential target at $180K
Within Wave C:
✅ Wave a: Pushed to $109K
✅ Wave b: Corrected down to 73K
73K
✅ Wave c: Now beginning and approaching a key breakout point
📌 The critical level? A daily candle close above $109K
If that happens, Bitcoin could enter its final impulsive leg toward $180K.
All technical signs point toward a major move — the structure, volume, and price action are aligned for what could be a historic breakout.
🔹 Wave A: Rally to $73,777 (with internal abc structure)
🔹 Wave B: Pullback to $49,000
🔹 Wave C: Currently unfolding — with a potential target at $180K
Within Wave C:
✅ Wave a: Pushed to $109K
✅ Wave b: Corrected down to
✅ Wave c: Now beginning and approaching a key breakout point
📌 The critical level? A daily candle close above $109K
If that happens, Bitcoin could enter its final impulsive leg toward $180K.
All technical signs point toward a major move — the structure, volume, and price action are aligned for what could be a historic breakout.
Trade active
Bitcoin has broken above $109,300 with a daily close, confirming entry into a new bullish wave. The next potential target lies in the $180K range. Momentum favors further upside.Disclaimer
The information and publications are not meant to be, and do not constitute, financial, investment, trading, or other types of advice or recommendations supplied or endorsed by TradingView. Read more in the Terms of Use.
Disclaimer
The information and publications are not meant to be, and do not constitute, financial, investment, trading, or other types of advice or recommendations supplied or endorsed by TradingView. Read more in the Terms of Use.