Hello, Traders!
If you’ve spent any time staring at crypto charts, you’ve probably asked: “Why is this happening?” And the truth is… there’s never one simple answer.
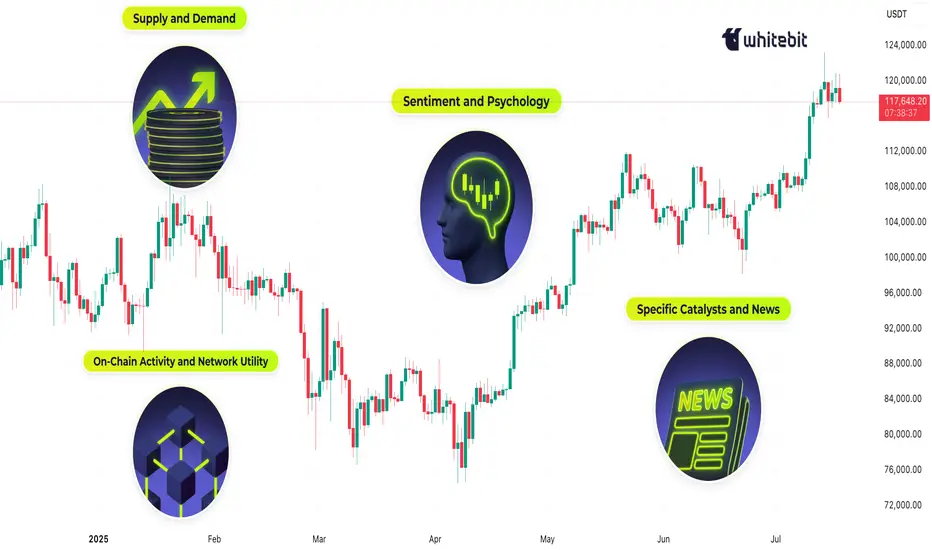
Crypto markets are complex, global, 24/7 systems. The forces behind a price move can be technical, fundamental, psychological or all at once. So let’s unpack what really moves this market.
1. Supply and Demand — The Fundamentals Behind the Volatility
At its core, crypto prices are governed by supply and demand. If more people want to buy than sell, the price goes up and vice versa. But it’s not that simple.
Take Bitcoin. It has a fixed max supply of 21 million, and most of those coins are already mined. But available liquidity on exchanges is much smaller and this is where things get interesting. During bull markets, demand surges while liquid supply dries up. That creates parabolic moves. Then you have supply unlocks, token vesting schedules, and inflationary emissions all of which affect how much of a coin is flowing into the market.
Example: When Lido enabled ETH withdrawals in 2023, it shifted the ETH supply dynamics, some saw it as bearish (more unlocked supply), others bullish (greater staking confidence).
2. Sentiment and Psychology: Fear & Greed Still Rule
If you want to understand the crypto market, start by studying people. Emotions drive decision-making, and crypto is still largely a retail-dominated space. Bull runs often start with doubt, accelerate with FOMO, and end in euphoria. Bear markets move from panic to despair to apathy. The crypto psychology chart rarely lies, but it always feels different in real time.
The classic “psychological numbers in trading”, like $10K, $20K, $100K BTC, often act as invisible walls of resistance or support. Why? Because traders anchor to these round levels.
👉 We’ve covered this phenomenon in detail in a dedicated post https://www.tradingview.com/chart/BTCUSDT/UUOTW0x0-The-Power-of-Round-Numbers-in-Trading/ “The Power of Round Numbers in Trading.” Highly recommend checking it out if you want to understand how these zones shape market psychology and price action.
3. On-Chain Activity and Network Utility
Fundamentals matter. But in crypto, fundamentals are on-chain. The transparency of blockchain networks provides valuable insights into fundamental usage and investor behavior, which often foreshadow price trends. On-chain metrics such as active addresses, transaction volumes, and wallet holdings offer insight into the health and sentiment of the crypto ecosystem:
Network Usage (Active Addresses & Transactions): A growing number of active addresses or transactions might indicate rising network demand and adoption. Empirical studies have found that BTC’s price strongly correlates with its on-chain activity – increases in the number of wallets, active addresses, and transaction counts tend to accompany price appreciation.
Exchange Inflows/Outflows: Tracking the movement of Bitcoin or Ether in and out of exchanges provides clues to investor intent. Large outflows from exchanges are often bullish signals – coins withdrawn to private wallets imply holders are opting to HODL rather than trade or sell, tightening the available supply on the market. For example, in late March 2025, as Bitcoin neared $90,000, exchange outflows hit a 7-month high (~11,574 BTC withdrawn in one day) mainly by whale holders, indicating strong confidence.
Mining Activity and Miner Behavior: In Proof-of-Work coins like Bitcoin, miners are forced sellers (regularly selling block rewards to cover costs), so their behavior can impact price. Periods of miner capitulation, when mining becomes unprofitable and many miners shut off or sell holdings, have historically aligned with market bottoms.
For example, in August 2024, Bitcoin experienced a miner “capitulation event”: daily miner outflows spiked to ~19,000 BTC (the highest in months) as the price dipped to around $ 49,000, suggesting that miners had dumped inventory as profit margins evaporated. Shortly after, the network hash rate quickly recovered to new highs, indicating that miners’ confidence was returning, even as the price was low.
Final Thoughts
In conclusion, the crypto market’s price movements are driven by a complex interplay of factors… Market sentiment and psychology can override fundamentals in the short run, leading to euphoric rallies or panicked crashes. On-chain metrics provide the ground truth of user adoption and big-holder behavior, often signaling trend changes before they happen. Halvings and tokenomics remind us that the code underlying these assets directly affects their value by controlling supply. And finally, specific catalysts and news events encapsulate how all these forces can converge in real time.
For enthusiasts, understanding “what moves the crypto market” is crucial for navigating its volatility. Crypto will likely remain a fast-evolving space, but its price movements are not random. They are the sum of these identifiable factors, all of which savvy market participants weigh in their quest to predict the next move in Bitcoin, Ethereum, and beyond.
What do you think? 👇🏻
If you’ve spent any time staring at crypto charts, you’ve probably asked: “Why is this happening?” And the truth is… there’s never one simple answer.
Crypto markets are complex, global, 24/7 systems. The forces behind a price move can be technical, fundamental, psychological or all at once. So let’s unpack what really moves this market.
1. Supply and Demand — The Fundamentals Behind the Volatility
At its core, crypto prices are governed by supply and demand. If more people want to buy than sell, the price goes up and vice versa. But it’s not that simple.
Take Bitcoin. It has a fixed max supply of 21 million, and most of those coins are already mined. But available liquidity on exchanges is much smaller and this is where things get interesting. During bull markets, demand surges while liquid supply dries up. That creates parabolic moves. Then you have supply unlocks, token vesting schedules, and inflationary emissions all of which affect how much of a coin is flowing into the market.
Example: When Lido enabled ETH withdrawals in 2023, it shifted the ETH supply dynamics, some saw it as bearish (more unlocked supply), others bullish (greater staking confidence).
2. Sentiment and Psychology: Fear & Greed Still Rule
If you want to understand the crypto market, start by studying people. Emotions drive decision-making, and crypto is still largely a retail-dominated space. Bull runs often start with doubt, accelerate with FOMO, and end in euphoria. Bear markets move from panic to despair to apathy. The crypto psychology chart rarely lies, but it always feels different in real time.
The classic “psychological numbers in trading”, like $10K, $20K, $100K BTC, often act as invisible walls of resistance or support. Why? Because traders anchor to these round levels.
👉 We’ve covered this phenomenon in detail in a dedicated post https://www.tradingview.com/chart/BTCUSDT/UUOTW0x0-The-Power-of-Round-Numbers-in-Trading/ “The Power of Round Numbers in Trading.” Highly recommend checking it out if you want to understand how these zones shape market psychology and price action.
3. On-Chain Activity and Network Utility
Fundamentals matter. But in crypto, fundamentals are on-chain. The transparency of blockchain networks provides valuable insights into fundamental usage and investor behavior, which often foreshadow price trends. On-chain metrics such as active addresses, transaction volumes, and wallet holdings offer insight into the health and sentiment of the crypto ecosystem:
Network Usage (Active Addresses & Transactions): A growing number of active addresses or transactions might indicate rising network demand and adoption. Empirical studies have found that BTC’s price strongly correlates with its on-chain activity – increases in the number of wallets, active addresses, and transaction counts tend to accompany price appreciation.
Exchange Inflows/Outflows: Tracking the movement of Bitcoin or Ether in and out of exchanges provides clues to investor intent. Large outflows from exchanges are often bullish signals – coins withdrawn to private wallets imply holders are opting to HODL rather than trade or sell, tightening the available supply on the market. For example, in late March 2025, as Bitcoin neared $90,000, exchange outflows hit a 7-month high (~11,574 BTC withdrawn in one day) mainly by whale holders, indicating strong confidence.
Mining Activity and Miner Behavior: In Proof-of-Work coins like Bitcoin, miners are forced sellers (regularly selling block rewards to cover costs), so their behavior can impact price. Periods of miner capitulation, when mining becomes unprofitable and many miners shut off or sell holdings, have historically aligned with market bottoms.
For example, in August 2024, Bitcoin experienced a miner “capitulation event”: daily miner outflows spiked to ~19,000 BTC (the highest in months) as the price dipped to around $ 49,000, suggesting that miners had dumped inventory as profit margins evaporated. Shortly after, the network hash rate quickly recovered to new highs, indicating that miners’ confidence was returning, even as the price was low.
Final Thoughts
In conclusion, the crypto market’s price movements are driven by a complex interplay of factors… Market sentiment and psychology can override fundamentals in the short run, leading to euphoric rallies or panicked crashes. On-chain metrics provide the ground truth of user adoption and big-holder behavior, often signaling trend changes before they happen. Halvings and tokenomics remind us that the code underlying these assets directly affects their value by controlling supply. And finally, specific catalysts and news events encapsulate how all these forces can converge in real time.
For enthusiasts, understanding “what moves the crypto market” is crucial for navigating its volatility. Crypto will likely remain a fast-evolving space, but its price movements are not random. They are the sum of these identifiable factors, all of which savvy market participants weigh in their quest to predict the next move in Bitcoin, Ethereum, and beyond.
What do you think? 👇🏻
Get guaranteed rewards of up to 1,000 USDT in Crypto Evolution by WhiteBIT on TradingView, partnered with Tether.
whitebit.com/m/crypto-evolution?utm_source=tradingview&utm_medium=signature&utm_campaign=cryptoevolution
whitebit.com/m/crypto-evolution?utm_source=tradingview&utm_medium=signature&utm_campaign=cryptoevolution
Related publications
Disclaimer
The information and publications are not meant to be, and do not constitute, financial, investment, trading, or other types of advice or recommendations supplied or endorsed by TradingView. Read more in the Terms of Use.