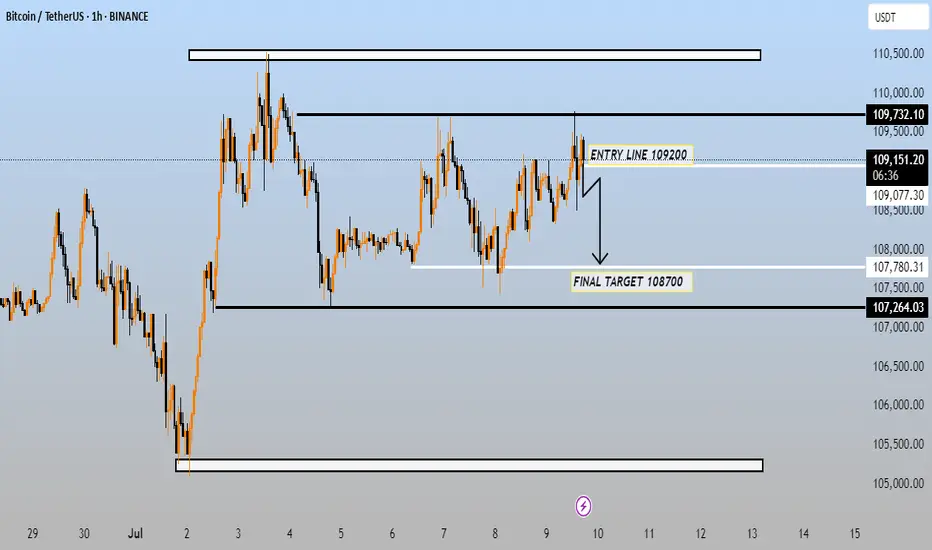
This chart is a Bitcoin (BTC/USDT) trading setup on the 1-hour timeframe. Here's a breakdown of the key elements:
🔍 Trade Setup Summary
Entry Line: 109200
Final Target: 108700
Current Price: 109118.14 (below the entry line)
Resistance Zone: Around 109732.10
Support Zone: Around 107264.03
📉 Strategy Interpretation
This appears to be a short trade setup:
Sell/Short Entry: At 109200
Target (Take Profit): 108700
This implies the trader expects BTC to drop from current levels toward the support area.
Stop-loss (not marked but implied): Likely just above 109732.10 (resistance zone)
⚠ Risk/Reward Outlook
Risk: Approximately 500–600 points (if SL is above resistance)
Reward: Around 500 points (from 109200 to 108700)
Risk-Reward Ratio: Close to 1:1, assuming a tight SL
---
Let me know if you want help calculating position size, refining this trade setup, or exploring a bullish alternative.
Join telegram free...
t.me/+16bIVCNBo0MzYzk0
Forex Gold & Crypto Signals with
detailed analysis & get consistent |
result ...
Gold Signals with peoper TP & SL for
high profit ...
t.me/+16bIVCNBo0MzYzk0
t.me/+16bIVCNBo0MzYzk0
Forex Gold & Crypto Signals with
detailed analysis & get consistent |
result ...
Gold Signals with peoper TP & SL for
high profit ...
t.me/+16bIVCNBo0MzYzk0
Disclaimer
The information and publications are not meant to be, and do not constitute, financial, investment, trading, or other types of advice or recommendations supplied or endorsed by TradingView. Read more in the Terms of Use.
