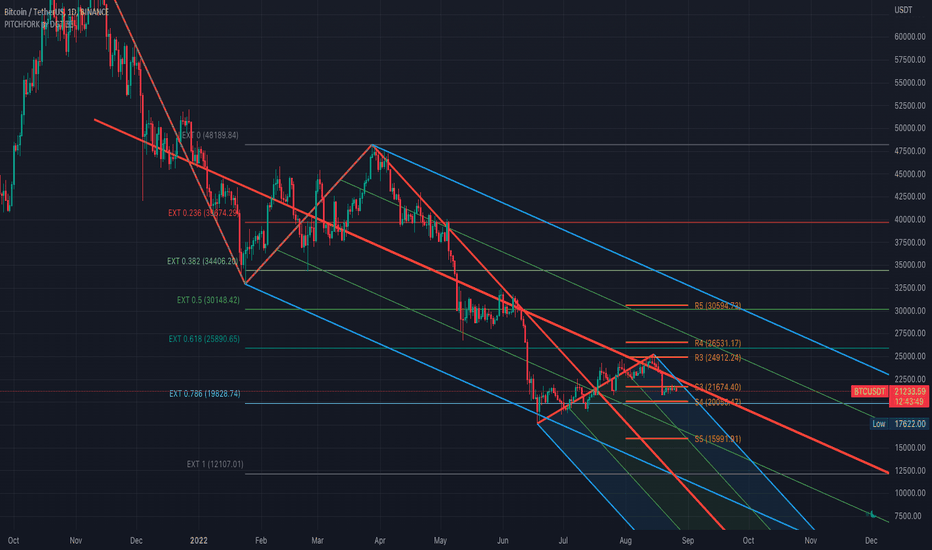
Pitchfork, is a technical indicator for a quick and easy way for traders to identify possible levels of support and resistance of an asset's price. It is presents and based on the idea that the market is geometric and cyclical in nature
* Developed by Alan Andrews, so sometimes called Andrews’ Pitchfork
* It is created by placing three points at the end of previous trends
* Schiff and Modified Pitchfork is a technical analysis tool derived from Andrews' Pitchfork
In general, traders will purchase the asset when the price falls near the support of either the center trendline or the lowest trendline. Conversely, they'll sell the asset when it approaches the resistance of either the center line or the highest trendline.
█ Usage Tips :
* Andrews' Pitchfork (Original) best fit in a Strong Trending Market
* Schiff and Modified Pitchfork better with Correcting or Sideways Market. Modified Pitchfork is almost identical to a Parallel Chanel
Step By Step Applying Pitchfork


Auto Pitchfork Study ʙʏ DGT ☼☾


Besides Auto Pitchfork Pivot, Support and Resistance plotting, study also includes Auto Fibonacci Retracement Levels and Zig Zag indicator

Link to the Auto Pitchfork ʙʏ DGT ☼☾ :
* Developed by Alan Andrews, so sometimes called Andrews’ Pitchfork
* It is created by placing three points at the end of previous trends
* Schiff and Modified Pitchfork is a technical analysis tool derived from Andrews' Pitchfork
In general, traders will purchase the asset when the price falls near the support of either the center trendline or the lowest trendline. Conversely, they'll sell the asset when it approaches the resistance of either the center line or the highest trendline.
█ Usage Tips :
* Andrews' Pitchfork (Original) best fit in a Strong Trending Market
* Schiff and Modified Pitchfork better with Correcting or Sideways Market. Modified Pitchfork is almost identical to a Parallel Chanel
Step By Step Applying Pitchfork
Auto Pitchfork Study ʙʏ DGT ☼☾
Besides Auto Pitchfork Pivot, Support and Resistance plotting, study also includes Auto Fibonacci Retracement Levels and Zig Zag indicator
Link to the Auto Pitchfork ʙʏ DGT ☼☾ :

Our Premium Indicators: sites.google.com/view/solemare-analytics
Disclaimer
The information and publications are not meant to be, and do not constitute, financial, investment, trading, or other types of advice or recommendations supplied or endorsed by TradingView. Read more in the Terms of Use.
Our Premium Indicators: sites.google.com/view/solemare-analytics
Disclaimer
The information and publications are not meant to be, and do not constitute, financial, investment, trading, or other types of advice or recommendations supplied or endorsed by TradingView. Read more in the Terms of Use.
