Bitcoin has rocketed from ~$94 000 to ~$103 250 in just days and is now consolidating between $102 364–$104 145. A Swing Failure Pattern at the top suggests a corrective pullback into one of three Fair Value Gaps aligned with key Fibonacci retracements, before the next leg up toward a fresh all-time high. This setup uses structure, inefficiency zones, and Fib levels to pinpoint high-probability entries.
📊 Chart Breakdown
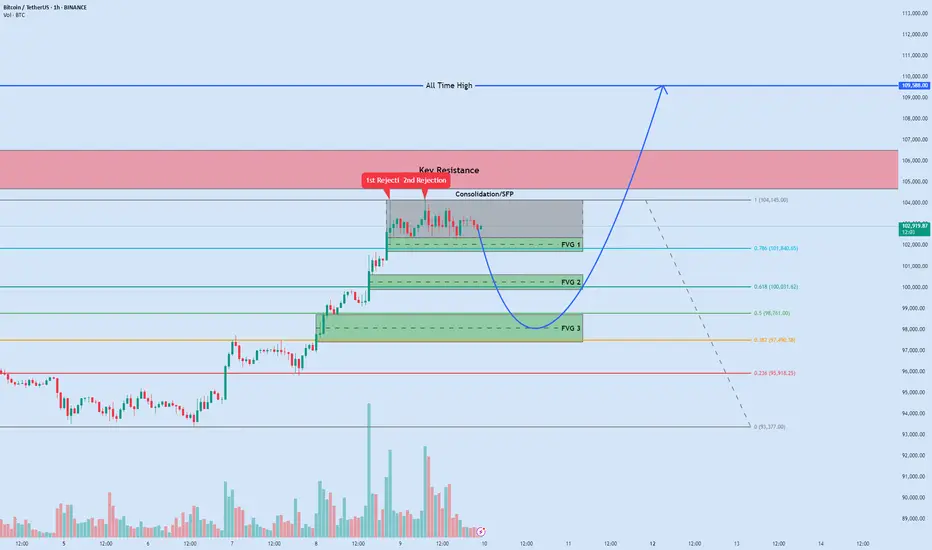
1. Current Picture: Consolidation & Warning ⚠️
- Range: $102 364 – $104 145
- Swing Failure Pattern (SFP): Price briefly wicks above $104 145 to grab liquidity, then reverses. This classic liquidity hunt often precedes a deeper retrace as late bulls are stopped out.
2. Fair Value Gaps (FVGs) – Untested Support Zones 🌊
FVGs are rapid imbalance areas where price left gaps in the order book. These zones act like magnets, drawing price back to “fill” inefficiencies.
3. Fibonacci Confluences (from $93 377 → $104 145) 📏
Fibonacci retracement levels often align with FVGs to form confluence support—ideal for swing entries.
📈📉 Navigating the Next Moves: Key Trade Scenarios 🧭
Given the current structure, with the SFP indicating a potential short-term top and strong FVG/Fibonacci confluences below, here are two primary scenarios we can watch for:
Scenario 1: The Short-Term Pullback Play (Short Position 📉🐻)
Scenario 2: The FVG Rebound & Rally (Long Position 📈🐂)
🎯 Execution Notes
- Patience & Confirmation: Avoid “blind” entries. Seek volume confirmation and clear reversal candle patterns on 1H/4H charts.
- Risk Management: Define stops before entry and size positions to risk no more than 1–2% per trade.
- Additional Signals: Watch for bullish RSI/RSI-MFI divergences or a turn in on-balance volume at support zones.
What’s your take? Which FVG/Fib level will hold? Share your insights below!
📊 Chart Breakdown
1. Current Picture: Consolidation & Warning ⚠️
- Range: $102 364 – $104 145
- Swing Failure Pattern (SFP): Price briefly wicks above $104 145 to grab liquidity, then reverses. This classic liquidity hunt often precedes a deeper retrace as late bulls are stopped out.
2. Fair Value Gaps (FVGs) – Untested Support Zones 🌊
FVGs are rapid imbalance areas where price left gaps in the order book. These zones act like magnets, drawing price back to “fill” inefficiencies.
- FVG 1 (Nearest): $101 700 – $102 364
- FVG 2 (Mid-Zone): $99 900 – $100 600
- FVG 3 (Deepest): $97 400 – $98 700
3. Fibonacci Confluences (from $93 377 → $104 145) 📏
Fibonacci retracement levels often align with FVGs to form confluence support—ideal for swing entries.
- 0.786 Fib @ $101 840.65: Sits squarely in FVG 1, a high-probability bounce zone.
- 0.618 Fib @ $100 031.62: Golden Ratio within FVG 2, offering strong support.
- 0.5 Fib @ $98 761 & 0.382 Fib @ $97 490.38: Cover top and mid-lower FVG 3 for a deep corrective entry.
📈📉 Navigating the Next Moves: Key Trade Scenarios 🧭
Given the current structure, with the SFP indicating a potential short-term top and strong FVG/Fibonacci confluences below, here are two primary scenarios we can watch for:
Scenario 1: The Short-Term Pullback Play (Short Position 📉🐻)
- Concept: Capitalizing on the SFP at the consolidation high (~$104,145) to trade the anticipated dip towards the FVG/Fibonacci support clusters.
Aggressive Entry: Look for entries around $103,500 – $103,900 if price retests the upper part of the consolidation after the SFP, showing weakness.
Conservative Entry: A break below the consolidation low (~$102,364) could offer a confirmation entry, potentially on a retest of this broken level as resistance.
- Stop-Loss 🛑: Place above the SFP high, e.g., $104,450 – $104,650, to protect against a false breakdown.
- Profit Targets (FVG Zones) 🎯TP1: The top of FVG 1 / 0.786 Fib area (~$102,300 – $101,840). This zone is critical.
TP2: The FVG 2 / 0.618 Fib area (~$100,600 – $100,030) if TP1 is breached with momentum.
- Trade Management & Considerations 🤔:
- Entry Confirmation: Watch for bearish price action on lower timeframes (e.g., 15m/1H rejection wicks, bearish engulfing) near the SFP high.
- Profit Taking: Consider taking partial profits at TP1. The reaction here is crucial.
- Reversal/Close Short: If price enters TP1 and shows strong bullish rejection (large wicks, engulfing bull candles, volume spike), close the short and prepare to flip to the long scenario.
- Holding for TP2: If price slices through TP1 with sustained bearish pressure, trail your stop above TP1 once it’s clearly broken.
- Invalidation: If price reclaims and holds above $104,650, the short thesis is invalidated.
- Entry Confirmation: Watch for bearish price action on lower timeframes (e.g., 15m/1H rejection wicks, bearish engulfing) near the SFP high.
Scenario 2: The FVG Rebound & Rally (Long Position 📈🐂)
- Concept: Entering on the expectation that one of the FVG/Fibonacci confluence zones will hold as support, leading to a rebound and continuation of the larger uptrend.
- Potential Entry Zones 📍:Zone A (Primary): FVG 1 / 0.786 Fib area ($101,700 – $102,364, sweet spot ~$101,840).
Zone B (Secondary): FVG 2 / 0.618 Fib area ($99,900 – $100,600, sweet spot ~$100,030).
- Stop-Loss 🛑:If entering in Zone A: Place below FVG 1, e.g., $101,350 – $101,150.
If entering in Zone B: Place below FVG 2, e.g., $99,600 – $99,400.
- Profit Targets 🎯:TP1: Back to the consolidation high / SFP area (~$104,145).
TP2: The key resistance zone ($104,675 – $106,500).
TP3 (Ultimate): The All-Time High ($109,588).
- Trade Management & Considerations 🤔:
- Entry Confirmation: Do not blindly enter. Wait for price to enter your chosen FVG zone AND then show clear bullish confirmation on lower timeframes (e.g., 1H/4H bullish engulfing, hammer, RSI divergence).
- Zone Prioritization: Zone A is the first test. If it fails and breaks down, Zone B becomes the next area of interest.
- Profit Taking & Scaling Out: Take partial profits at TP1 and again at TP2 to secure gains.
- Risk Reduction: After TP1 is hit, move your stop-loss to breakeven or slightly in profit.
- Invalidation: A decisive break below $99,400 invalidates the bounce thesis and suggests a deeper correction.
- Entry Confirmation: Do not blindly enter. Wait for price to enter your chosen FVG zone AND then show clear bullish confirmation on lower timeframes (e.g., 1H/4H bullish engulfing, hammer, RSI divergence).
🎯 Execution Notes
- Patience & Confirmation: Avoid “blind” entries. Seek volume confirmation and clear reversal candle patterns on 1H/4H charts.
- Risk Management: Define stops before entry and size positions to risk no more than 1–2% per trade.
- Additional Signals: Watch for bullish RSI/RSI-MFI divergences or a turn in on-balance volume at support zones.
Disclaimer: This is for educational/informational purposes only and not financial advice. Crypto trading carries high risk—always DYOR and consult a qualified advisor.
What’s your take? Which FVG/Fib level will hold? Share your insights below!
Trade active
BTC has been rejected several times at resistance. A very cautious short position can be opened with a tight stop loss at around $105,000.Disclaimer
The information and publications are not meant to be, and do not constitute, financial, investment, trading, or other types of advice or recommendations supplied or endorsed by TradingView. Read more in the Terms of Use.
Disclaimer
The information and publications are not meant to be, and do not constitute, financial, investment, trading, or other types of advice or recommendations supplied or endorsed by TradingView. Read more in the Terms of Use.