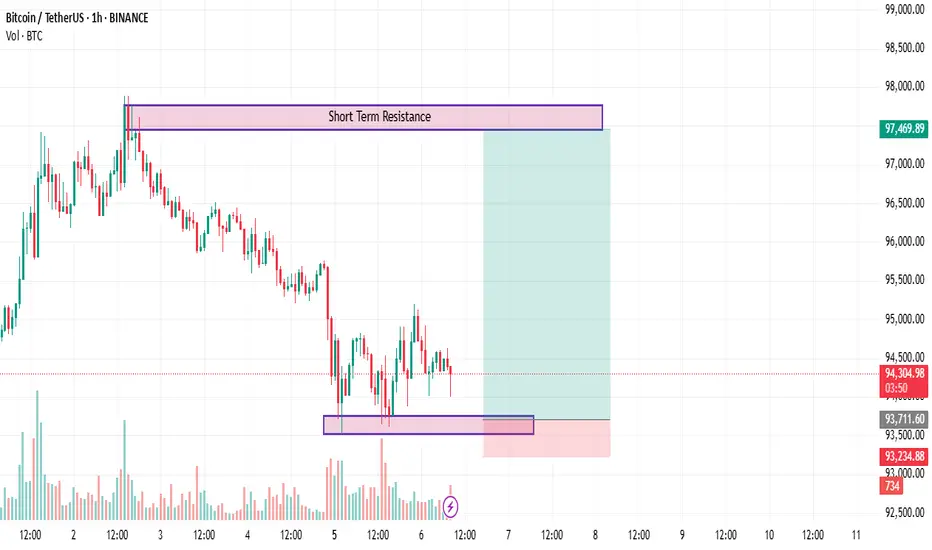
This chart highlights two significant zones for BTC/USDT on the 1-hour timeframe. The lower purple zone represents a demand area where buyers have previously shown interest, indicating potential support. The upper purple zone marks a short-term barrier where previous upward movements have paused, suggesting overhead pressure.
The current price action shows BTC consolidating near the support region. A move upward from this level could lead to a retest of the upper resistance zone, providing a favorable risk-to-reward scenario. Volume levels are also monitored for confirmation of momentum.
The current price action shows BTC consolidating near the support region. A move upward from this level could lead to a retest of the upper resistance zone, providing a favorable risk-to-reward scenario. Volume levels are also monitored for confirmation of momentum.
Trade closed: target reached
*Status Update: Target Achieved*
The projected target level in the Bitcoin (BTC/USDT) setup has been successfully reached. After consolidating at the support zone, the price surged with strong bullish momentum, breaking through the resistance zone. The upward movement continued, hitting the short-term resistance level as anticipated. This successful move confirms the analysis based on momentum and breakout strategy.
The setup has been executed effectively, with the expected target achieved as planned.
I Will Sharing Personal Entries &How Trades.
All Of These For Free & I Will Not Take a Penny From Anyone .
So Please My Friends Trade On Your Own Risk
If You Guys Like My Ideas Then Follow Me And Comments Me .
All Of These For Free & I Will Not Take a Penny From Anyone .
So Please My Friends Trade On Your Own Risk
If You Guys Like My Ideas Then Follow Me And Comments Me .
Disclaimer
The information and publications are not meant to be, and do not constitute, financial, investment, trading, or other types of advice or recommendations supplied or endorsed by TradingView. Read more in the Terms of Use.