
I am seeing a trade opportunity for Bitcoin (XBT) based on the hourly time frame and the last candle that closed.
This is a bullish pin bar; marked with a yellow circle on the chart.
The chart already shows the direction, stop loss and target.
If you are interested in this trade... Give me a like and leave me a comment and I will share a full trade (like our ETHUSD, TRXH19, EOSH19 and others). You can find these in the 'related ideas' below this post.
Your support is truly appreciated.
Namaste.
Note
Here are the details of the trade, I will share several more BitMEX (XBT, TRXH19, ETHUSD & others) trades if we reach 100 likes.Thanks a lot for the support.
----------
Trade: LONG XBT
Leverage: 25X
Buy In: Up to $3595
Time Frame: 1H
Targets:
(1) $3620 -Reached
(2) $3640 -Reached
(3) $3666
Stop Loss: Close 1H candle below $3572.
Profit Potential: 49.25% ROE
Capital Allocation: <2.5%.
----
Raise stop loss above buy in price.
Enjoy the profits.
Namaste.
Note
You can read my latest Bitcoin (BTCUSD) update here: 
Your support is truly appreciated.
Note
We are looking to break $3616 (orange line) to continue moving up. This is BXBT (Which is BitMEX Bitcoin / USD Index).Note
We broke above EMA200 (orange line - $3616) and moved up to our next target as mentioned above. This generated a nice 17.75% ROE on 25X leverage.Note
Other profitable trades. TRXH19:
![[TRXH19][LONG][10X][176% ROE] Tron on BitMEX](https://s3.tradingview.com/7/7p5uCH2d_mid.png)
ETHUSD:
![[ETHUSD][LONG][10X][59% ROE] Ethereum Short Term (1H) on BitMEX](https://s3.tradingview.com/v/VdJ3NMjn_mid.png)
POWRBTC +32%
](https://s3.tradingview.com/q/qSFx0vIS_mid.png)
OAXBTC +64%
![[OAXBTC][120% PP] openANX Trade Signal](https://s3.tradingview.com/r/rf7SZnrZ_mid.png)
ADTBTC +30%
 AdToken Long Term](https://s3.tradingview.com/w/W4Me867s_mid.png)
STEEMBTC +32%
 STEEM Profits Potential (1000-9000%+)](https://s3.tradingview.com/m/M8knHZWX_mid.png)
Note
Our next challenge is EMA300 (gray line) which is sitting at $3639. If Bitcoin (BXBT) can break and close above this level (preferably above $3645), we can reach our last target.Here is the chart:
Note
All targets reached for 49.25%+ ROE.Enjoy the profits.
Targets:
(1) $3620 -Reached
(2) $3640 -Reached
(3) $3666 -Reached.
Please who your support by visiting my latest Bitcoin (BTCUSD) update... Make sure to hit LIKE.
Namaste.
Note
Some other charts:S&P 500 (SPX)

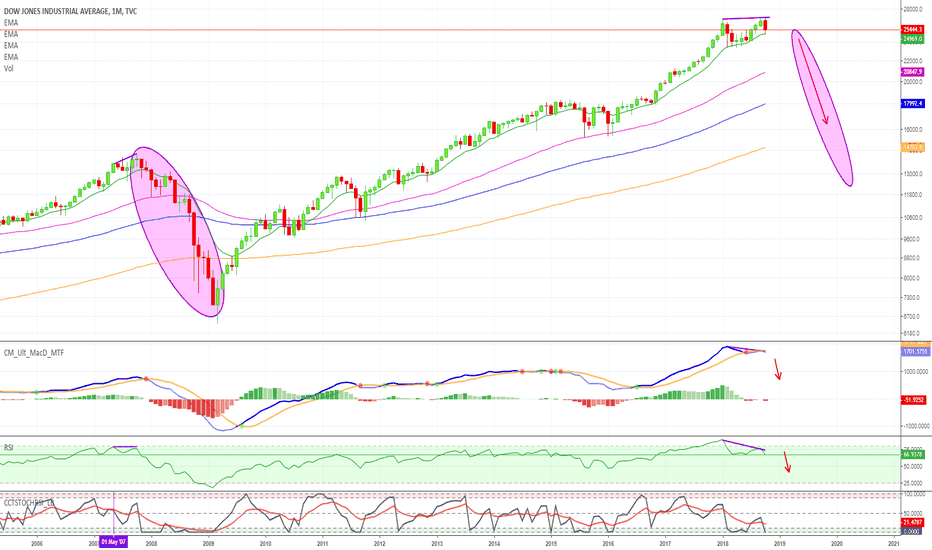
Dow Jones (DJI)
Gold (XAUUSD)
![Gold (XAUUSD) Hidden Bullish Divergence - Moving Up [10% PP]!](https://s3.tradingview.com/u/UnhBBcbx_mid.png)
Note
Please hit like to show your support:CBOE VIX

NASDAQ Composite

Apple (APPL)
1)

2)

NIKKEI (NI225)

USDEUR
![[USDEUR] U.S. DOLLAR Drops Against The EURO (LongTerm Analysis)](https://s3.tradingview.com/5/5fiTSqRP_mid.png)
EURUSD

Note
TODAY IS ALWAYS A BEAUTIFUL When I wake up in the morning I can't help but enjoy the sun.
The morning breeze hits me, being alive... It is truly an incredible joy.
Today is a very beautiful day, for me, it has always been this way.
This isn't because I live in the beach, in the mountains or near a great lake.
It is all about your mind, your imagination and the feelings that you share with other people everyday.
So improve your thinking and you too will always see an amazingly beautiful day...
LIKE TODAY!
Today is a beautiful day.
Namaste.
Trade closed: target reached
ALL TARGETS REACHED!Namaste.
🚨 TOP FREE Trades
ETH +1700% · AAVE +1134%
XRP +749% · DOGS +868%
BTC +563% · SOL +658%
t.me/anandatrades/1350
🚨 FREE Analyses & New Results
t.me/masteranandatrades/6499
🚨 PREMIUM LIFETIME (Since 2017)
lamatrades.com
ETH +1700% · AAVE +1134%
XRP +749% · DOGS +868%
BTC +563% · SOL +658%
t.me/anandatrades/1350
🚨 FREE Analyses & New Results
t.me/masteranandatrades/6499
🚨 PREMIUM LIFETIME (Since 2017)
lamatrades.com
Related publications
Disclaimer
The information and publications are not meant to be, and do not constitute, financial, investment, trading, or other types of advice or recommendations supplied or endorsed by TradingView. Read more in the Terms of Use.