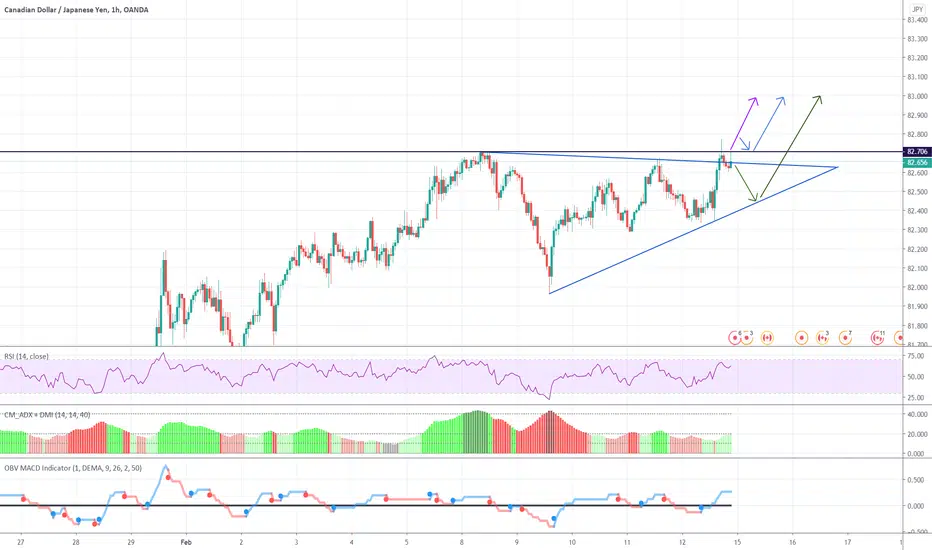
CADJPY possible long scenarios represented by the coloured arrows.
Scenario 1 (Green Arrow): we see a wedge pattern where it bounces of lower boundary to then make a move to the upside breaking out to resistance at 83.000 (psychological price level).
Scenario 2 (Blue Arrow): We see it break upper resistance (Black line), retest then move towards 83.000
Scenario 3: We watch for a breakout of upper resistance and a move towards 83.000
Looking at the moving average we see price in a upwards trend, hence the reason for not looking at taking a short
Trade closed: target reached
Fantastic trade here, broke out to the upsideDisclaimer
The information and publications are not meant to be, and do not constitute, financial, investment, trading, or other types of advice or recommendations supplied or endorsed by TradingView. Read more in the Terms of Use.
Disclaimer
The information and publications are not meant to be, and do not constitute, financial, investment, trading, or other types of advice or recommendations supplied or endorsed by TradingView. Read more in the Terms of Use.