TOP DOWN ANALYSIS FOR CADJPY
Note
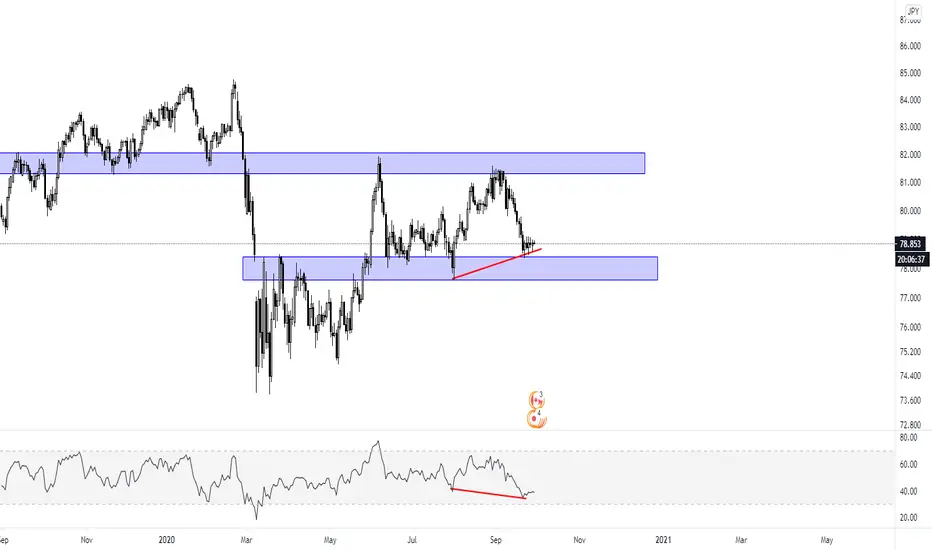
On the daily timeframe, we can see that there was a massive fall around February and March and you have clearly seen that the two zones drawn are strong SR zones. SR standing for Support-Resistance.
Asides that, we have seen that the RSI has made lower lows towards its oversold level and price is making higher lows forming a bullish divergence.
Note
On a 4 hour TimeFrame, we have seen that higher lows price was making which formed a bullish divergence has formed a good support level.
On the other hand, we can see that there is a downtrending trendline that has been broken.
Note
On a 1 hour TimeFrame, besides seeing a visible trendline, we can see an ascending triangle formation in the marked yellow zone and RSI is also balanced on an ascending support level.
Note
On a 30 minutes timeframe, we can see that there was a downtrending channel after the breakout from the downtrend.
The channel was broken and retested and now heading towards the red zone.
Note
So what am I expecting?😃Note
ONE
Note
TWO
Note
After the breakout and retest on the red zone, where will I put my take profit and Stop Loss to ensure proper risk management?Note
Personally, I would buy at the price close above the red zone with my Stop Loss and take profit levels put into consideration.😊
Disclaimer
The information and publications are not meant to be, and do not constitute, financial, investment, trading, or other types of advice or recommendations supplied or endorsed by TradingView. Read more in the Terms of Use.
Disclaimer
The information and publications are not meant to be, and do not constitute, financial, investment, trading, or other types of advice or recommendations supplied or endorsed by TradingView. Read more in the Terms of Use.