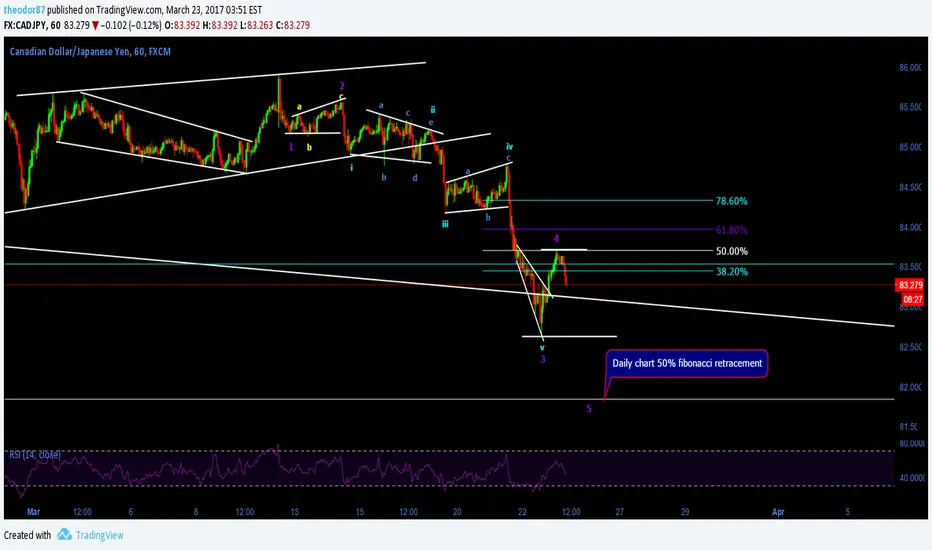
As we can see on lower timeframe price has finished wave 4 at 50% retracement of wave 3 and now is in 5th wave. According to wave count price should go to at least where wave 3 is finished or even to 50% retracement of daily chart. Good entry would be to wait for price to make a pull back and enter after break out to the down side.
Note
Good opportunity to short if price breaks flag formationNote
"Military force is not constant" - Sun Tzu from the book The art of war. Market is like water its constantly changing form all you have to do is recognaze patterns and crack the chart from bigger to smaller timeframes.Note
Possible start of big up move impulse leg. On 15 minute chart we can see that 5th wave failed to go below of wave 3 which is refered to truncated 5th wave also we have hidden divergence showing on RSI
Also on Daily chart we can see that price is sitting on 38.2% fibonacci retracement which is another indication of possible strong impulse to the up side and the end of big flag correction.
Disclaimer
The information and publications are not meant to be, and do not constitute, financial, investment, trading, or other types of advice or recommendations supplied or endorsed by TradingView. Read more in the Terms of Use.
Disclaimer
The information and publications are not meant to be, and do not constitute, financial, investment, trading, or other types of advice or recommendations supplied or endorsed by TradingView. Read more in the Terms of Use.