As of May 30, 2025, here are the 45-minute interval support and resistance levels for Central Depository Services (India) Ltd (NSE: CDSL), based on the latest available data:
📊 Current Price Snapshot
Last Traded Price: ₹1,529.70
Day’s Range: ₹1,513.30 – ₹1,554.00
52-Week Range: ₹917.63 – ₹1,989.80
Volume: 5,711,655 shares
VWAP: ₹1,539.78
Market Capitalization: ₹31,971 crore
Beta: 1.34
Dividend Yield: 0.82%
Book Value per Share: ₹73.16
Upper Circuit Limit: ₹1,664.30
Lower Circuit Limit: ₹1,361.70
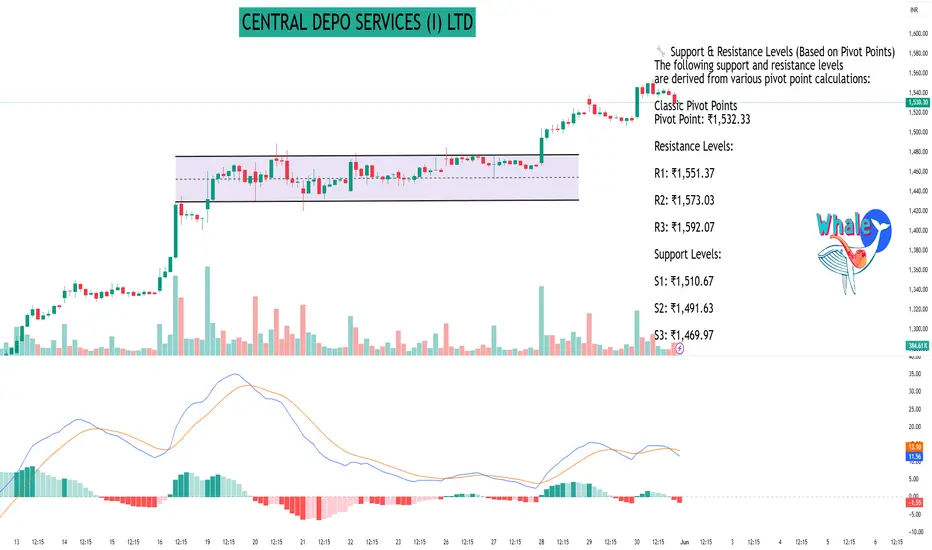
🔧 Support & Resistance Levels (Based on Pivot Points)
The following support and resistance levels are derived from various pivot point calculations:
Classic Pivot Points
Pivot Point: ₹1,532.33
Resistance Levels:
R1: ₹1,551.37
R2: ₹1,573.03
R3: ₹1,592.07
Support Levels:
S1: ₹1,510.67
S2: ₹1,491.63
S3: ₹1,469.97
Fibonacci Pivot Points
Pivot Point: ₹1,532.33
Resistance Levels:
R1: ₹1,547.88
R2: ₹1,557.49
R3: ₹1,573.03
Support Levels:
S1: ₹1,516.79
S2: ₹1,507.18
S3: ₹1,491.63
Camarilla Pivot Points
Pivot Point: ₹1,532.33
Resistance Levels:
R1: ₹1,533.43
R2: ₹1,537.16
R3: ₹1,540.89
Support Levels:
S1: ₹1,525.97
S2: ₹1,522.24
S3: ₹1,518.51
📈 Technical Indicators Summary
Relative Strength Index (RSI): Data not available
MACD: Data not available
ADX: Data not available
Stochastic RSI: Data not available
Supertrend: Data not available
Parabolic SAR (PSAR): Data not available
🧭 Trading Outlook
Trend: Neutral to Slightly Bullish
Recommendation: The stock is trading near its pivot point, indicating a neutral stance. Traders should monitor for a breakout above R1 (₹1,551.37) for bullish confirmation or a breakdown below S1 (₹1,510.67) for bearish signals.
📊 Current Price Snapshot
Last Traded Price: ₹1,529.70
Day’s Range: ₹1,513.30 – ₹1,554.00
52-Week Range: ₹917.63 – ₹1,989.80
Volume: 5,711,655 shares
VWAP: ₹1,539.78
Market Capitalization: ₹31,971 crore
Beta: 1.34
Dividend Yield: 0.82%
Book Value per Share: ₹73.16
Upper Circuit Limit: ₹1,664.30
Lower Circuit Limit: ₹1,361.70
🔧 Support & Resistance Levels (Based on Pivot Points)
The following support and resistance levels are derived from various pivot point calculations:
Classic Pivot Points
Pivot Point: ₹1,532.33
Resistance Levels:
R1: ₹1,551.37
R2: ₹1,573.03
R3: ₹1,592.07
Support Levels:
S1: ₹1,510.67
S2: ₹1,491.63
S3: ₹1,469.97
Fibonacci Pivot Points
Pivot Point: ₹1,532.33
Resistance Levels:
R1: ₹1,547.88
R2: ₹1,557.49
R3: ₹1,573.03
Support Levels:
S1: ₹1,516.79
S2: ₹1,507.18
S3: ₹1,491.63
Camarilla Pivot Points
Pivot Point: ₹1,532.33
Resistance Levels:
R1: ₹1,533.43
R2: ₹1,537.16
R3: ₹1,540.89
Support Levels:
S1: ₹1,525.97
S2: ₹1,522.24
S3: ₹1,518.51
📈 Technical Indicators Summary
Relative Strength Index (RSI): Data not available
MACD: Data not available
ADX: Data not available
Stochastic RSI: Data not available
Supertrend: Data not available
Parabolic SAR (PSAR): Data not available
🧭 Trading Outlook
Trend: Neutral to Slightly Bullish
Recommendation: The stock is trading near its pivot point, indicating a neutral stance. Traders should monitor for a breakout above R1 (₹1,551.37) for bullish confirmation or a breakdown below S1 (₹1,510.67) for bearish signals.
Hello Guys ..
WhatsApp link- wa.link/d997q0
Email - techncialexpress@gmail.com ...
Script Coder/Trader//Investor from India. Drop a comment or DM if you have any questions! Let’s grow together!
WhatsApp link- wa.link/d997q0
Email - techncialexpress@gmail.com ...
Script Coder/Trader//Investor from India. Drop a comment or DM if you have any questions! Let’s grow together!
Related publications
Disclaimer
The information and publications are not meant to be, and do not constitute, financial, investment, trading, or other types of advice or recommendations supplied or endorsed by TradingView. Read more in the Terms of Use.