1. Overall Trend
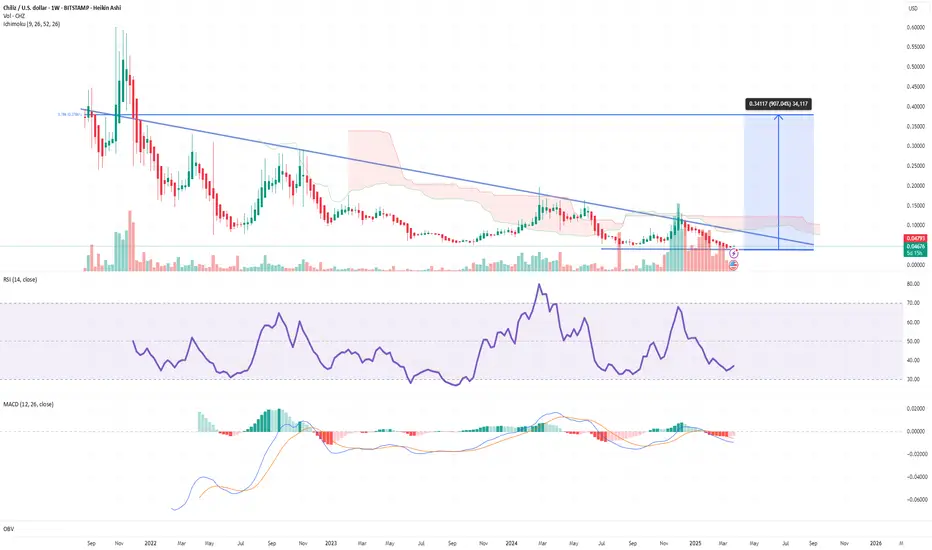
CHZ remains in a long-term downtrend, as shown by the descending trendline from its 2021 highs.
However, price is now consolidating near a long-term support zone around $0.045–$0.05, signaling a potential reversal zone.
Price is approaching a key confluence area: the downtrend line + bottom of the Ichimoku Cloud.
2. Ichimoku Cloud
Price is still below the cloud, indicating bearish momentum.
But the cloud is thin, and there’s a potential “Kumo Twist” ahead — a favorable condition for a trend reversal.
A successful breakout above the cloud would signal a strong bullish shift.
3. MACD (Moving Average Convergence Divergence)
MACD line is slightly below the signal line, but both are near the zero level.
A bullish crossover may be forming, indicating potential upward momentum.
Histogram is nearly neutral, showing weakening bearish pressure.
4. RSI (Relative Strength Index)
RSI is around 36.89, below the 50-neutral line, suggesting bearish bias.
However, there’s a small upward slope — a sign of possible reversal.
RSI crossing above 50 would confirm strength in buying momentum.
5. Volume
Volume has been declining over time, indicating accumulation.
A strong breakout will require a significant volume surge.
6. Chart Pattern
CHZ seems to be forming a falling wedge or a compression zone, typical of accumulation before breakout.
A breakout above $0.07 would confirm this pattern.
7. Upside Target
If CHZ breaks out, the chart suggests a long-term target near the 0.786 Fibonacci retracement level (~$0.39).
This represents a potential +900% move from current levels.
Disclaimer
The information and publications are not meant to be, and do not constitute, financial, investment, trading, or other types of advice or recommendations supplied or endorsed by TradingView. Read more in the Terms of Use.
Disclaimer
The information and publications are not meant to be, and do not constitute, financial, investment, trading, or other types of advice or recommendations supplied or endorsed by TradingView. Read more in the Terms of Use.