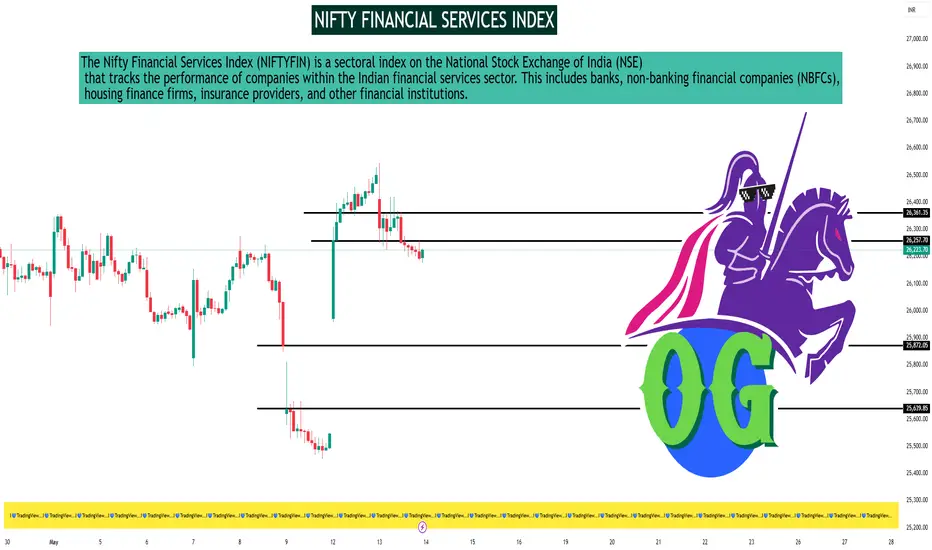
As of May 13, 2025, the Nifty Financial Services Index (NIFTYFIN) closed at 26,206.00, reflecting a decline of 1.10% for the day.
📊 30-Minute Timeframe Technical Overview
Key Support and Resistance Levels:
Support: Approximately 25,245.07
Resistance: Approximately 26,562.40
These levels are derived from recent price actions and are crucial for traders monitoring short-term movements.
Technical Indicators Summary:
Relative Strength Index (RSI 14): 52.33 – Neutral
Stochastic Oscillator (9,6): 98.35 – Overbought
Stochastic RSI (14): 2.60 – Oversold
MACD (12,26): 54.67 – Buy
Average Directional Index (ADX 14): 15.72 – Neutral
Williams %R: -1.94 – Overbought
Commodity Channel Index (CCI 14): -48.30 – Neutral
Average True Range (ATR 14): 166.29 – Indicates lower volatility
Rate of Change (ROC): 2.80 – Buy
Bull/Bear Power (13): -19.22 – Sell
Interpretation:
The technical indicators present a mixed outlook. While the MACD and ROC suggest bullish momentum, the overbought readings from the Stochastic Oscillator and Williams %R indicate potential for a short-term pullback. The neutral RSI and ADX values suggest a lack of strong directional momentum.
📈 Accessing 30-Minute Charts
For real-time 30-minute interval charts and advanced technical analysis tools, consider the following platforms:
TradingView – Nifty Financial Services Index
Investing.com – Nifty Financial Services Chart
Groww Terminal – Nifty Financial Services
These platforms offer customizable charts with various indicators to assist in your analysis.
Hello Guys ..
WhatsApp link- wa.link/d997q0
Email - techncialexpress@gmail.com ...
Script Coder/Trader//Investor from India. Drop a comment or DM if you have any questions! Let’s grow together!
WhatsApp link- wa.link/d997q0
Email - techncialexpress@gmail.com ...
Script Coder/Trader//Investor from India. Drop a comment or DM if you have any questions! Let’s grow together!
Related publications
Disclaimer
The information and publications are not meant to be, and do not constitute, financial, investment, trading, or other types of advice or recommendations supplied or endorsed by TradingView. Read more in the Terms of Use.