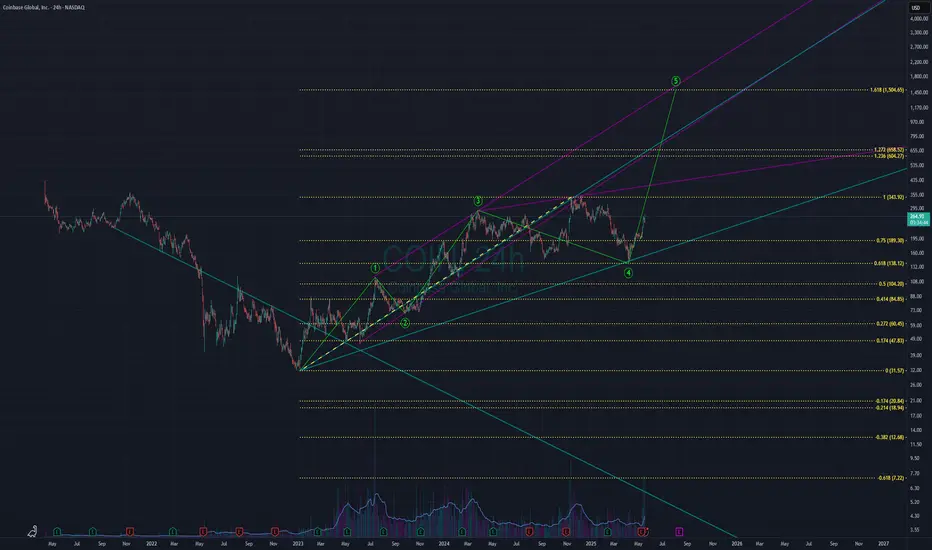
Let’s analyze how the coin, trading at $264.99, can reach the 1.618 Fibonacci target of $1,504.65, using first principles and focusing on the chart’s technical setup without referencing the trend line labels.
**1. Starting Point**: The coin is at $264.99 on a 4-hour chart, near a lower trend line around $260-$300 where the price has previously found support. This suggests potential for an upward move if buyers step in.
**2. Elliott Wave Framework**: The chart shows a completed five-wave structure followed by a three-wave correction. At $264.99, the coin is likely beginning a new impulsive wave (e.g., wave 1 or C of a larger pattern), which often targets Fibonacci extensions like 1.618.
**3. Fibonacci Target**: The 1.618 Fibonacci extension is at $1,504.65, a typical target for impulsive waves. This level is calculated by projecting the length of a prior wave from the current base around $260-$300.
**4. Key Levels**:
- **Resistance**: A descending trend line around $600-$700 acts as the first major barrier. Breaking above this with strong momentum signals a bullish continuation.
- **Support**: The $260-$300 area must hold to maintain the uptrend. A break below could indicate a reversal.
**5. Path to $1,504.65**:
- From $264.99, the coin needs to rally, breaking the $600-$700 resistance to confirm the uptrend.
- An intermediate Fibonacci level around $975 may pose minor resistance, but a strong trend should push through.
- The $1,239.66 move ($1,504.65 - $264.99), a 468% increase, requires sustained buying pressure.
**6. Market Dynamics**: Impulsive waves rely on strong buyer momentum. If volume and market sentiment align, the coin can climb steadily. Failure to break $600-$700 or a drop below $260 would challenge the bullish scenario.
**Conclusion**: The coin at $264.99 can reach $1,504.65 if it holds above $260, breaks the $600-$700 resistance, and maintains bullish momentum. The Elliott Wave and Fibonacci structure supports this target, but the price levels suggest this isn’t Bitcoin. Watch the $260 support and $600-$700 resistance for confirmation.
Disclaimer
The information and publications are not meant to be, and do not constitute, financial, investment, trading, or other types of advice or recommendations supplied or endorsed by TradingView. Read more in the Terms of Use.
Disclaimer
The information and publications are not meant to be, and do not constitute, financial, investment, trading, or other types of advice or recommendations supplied or endorsed by TradingView. Read more in the Terms of Use.