# **Coinbase (COIN) – Technical Analysis**
## **Current Market Overview**
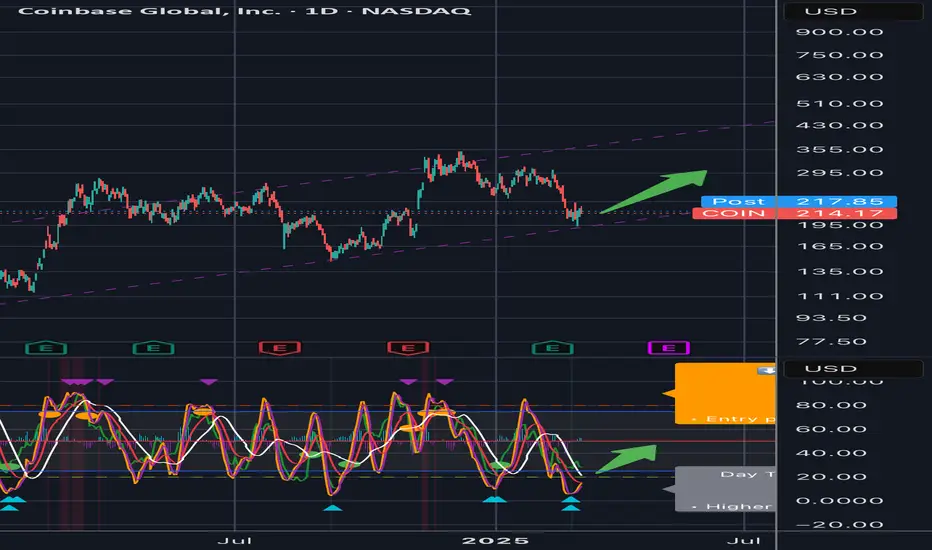
- **Price:** $214.17
- **Trend:** Bullish within an **ascending channel**
- **Support Zone:** $200 - $205 (Trendline Support)
- **Resistance Levels:**
- **Short-Term:** $230 - $240
- **Mid-Term:** $270
- **Long-Term:** $300+
---
## **Chart Patterns & Indicators**
### **1. Ascending Channel**
- Price is **respecting the lower trendline**, indicating a potential bounce.
- **Holding above the trendline** supports a continuation towards $270+.
### **2. Stochastic RSI – Oversold**
- Deeply oversold **(below 20)**, signaling potential upward momentum.
- Historically, price has bounced after hitting this level.
### **3. Volume & Confirmation**
- Need a **break above $230 with volume** to confirm upside strength.
---
## **Trade Plan & Price Targets**
### **Short-Term (1-2 weeks)**
- **Bias:** Bullish
- **Entry Zone:** $210 - $215
- **Stop Loss:** Below $200 (trendline break invalidates setup)
- **Target 1:** $230 (resistance level)
- **Target 2:** $240 (next key level)
### **Near-Term (1-3 months)**
- **Bias:** Bullish
- **Price Target:** $270 (upper range of channel)
- **Risk:** Medium (watch for rejection at $230)
### **Long-Term (6-12 months)**
- **Bias:** Strongly Bullish
- **Target 1:** $300 (upper trendline resistance)
- **Target 2:** $350+ (breakout scenario)
---
## **Risk Considerations**
- A **break below $200 invalidates** the setup.
- Macro conditions and crypto market correlation **impact price action**.
---
### **Final Thesis**
✅ **Bullish continuation likely if price holds $205-$210.**
🚀 **Breakout above $230 needed for strong upward momentum.**
⚠️ **Break below $200 = potential trend shift, bearish risk.**
## **Current Market Overview**
- **Price:** $214.17
- **Trend:** Bullish within an **ascending channel**
- **Support Zone:** $200 - $205 (Trendline Support)
- **Resistance Levels:**
- **Short-Term:** $230 - $240
- **Mid-Term:** $270
- **Long-Term:** $300+
---
## **Chart Patterns & Indicators**
### **1. Ascending Channel**
- Price is **respecting the lower trendline**, indicating a potential bounce.
- **Holding above the trendline** supports a continuation towards $270+.
### **2. Stochastic RSI – Oversold**
- Deeply oversold **(below 20)**, signaling potential upward momentum.
- Historically, price has bounced after hitting this level.
### **3. Volume & Confirmation**
- Need a **break above $230 with volume** to confirm upside strength.
---
## **Trade Plan & Price Targets**
### **Short-Term (1-2 weeks)**
- **Bias:** Bullish
- **Entry Zone:** $210 - $215
- **Stop Loss:** Below $200 (trendline break invalidates setup)
- **Target 1:** $230 (resistance level)
- **Target 2:** $240 (next key level)
### **Near-Term (1-3 months)**
- **Bias:** Bullish
- **Price Target:** $270 (upper range of channel)
- **Risk:** Medium (watch for rejection at $230)
### **Long-Term (6-12 months)**
- **Bias:** Strongly Bullish
- **Target 1:** $300 (upper trendline resistance)
- **Target 2:** $350+ (breakout scenario)
---
## **Risk Considerations**
- A **break below $200 invalidates** the setup.
- Macro conditions and crypto market correlation **impact price action**.
---
### **Final Thesis**
✅ **Bullish continuation likely if price holds $205-$210.**
🚀 **Breakout above $230 needed for strong upward momentum.**
⚠️ **Break below $200 = potential trend shift, bearish risk.**
Disclaimer
The information and publications are not meant to be, and do not constitute, financial, investment, trading, or other types of advice or recommendations supplied or endorsed by TradingView. Read more in the Terms of Use.
Disclaimer
The information and publications are not meant to be, and do not constitute, financial, investment, trading, or other types of advice or recommendations supplied or endorsed by TradingView. Read more in the Terms of Use.