As of May 30, 2025, Concord Biotech Ltd (NSE: CONCORDBIO) closed at ₹1,748.50, marking a 4.9% increase from the previous close of ₹1,666.90 .
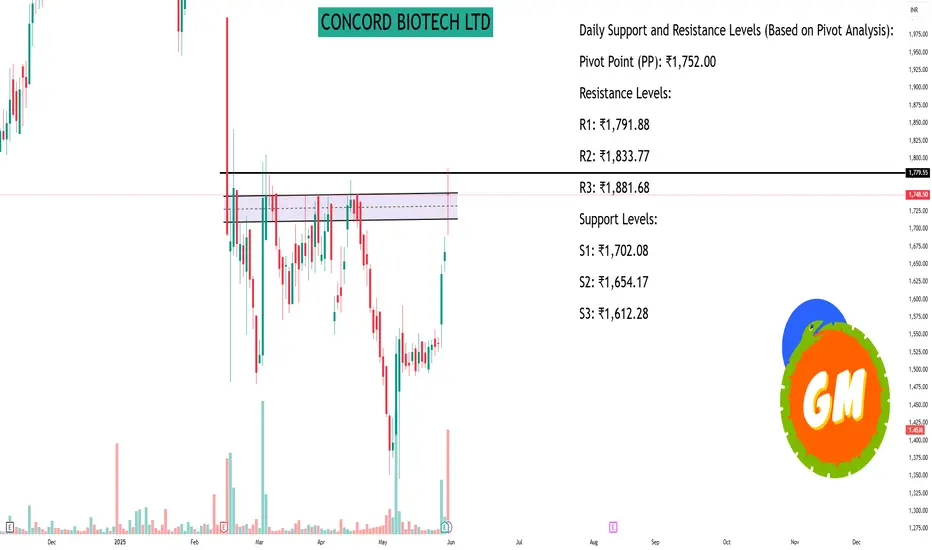
Daily Support and Resistance Levels (Based on Pivot Analysis):
Pivot Point (PP): ₹1,743.97
Resistance Levels:
R1: ₹1,791.88
R2: ₹1,833.77
R3: ₹1,881.68
Support Levels:
S1: ₹1,702.08
S2: ₹1,654.17
S3: ₹1,612.28
These levels are derived from the previous day's trading range and can serve as reference points for intraday trading decisions .
Technical Indicators:
Relative Strength Index (RSI): Over 65, indicating bullish momentum.
MACD: The MACD line has crossed above the signal line, suggesting a potential upward trend.
Volume: An increase in trading volume supports the bullish sentiment.
These indicators suggest that the stock is experiencing positive momentum, but it's essential to monitor for any changes in trend .
Key Observations:
Short-Term Range: The stock is trading between ₹1,600 (support) and ₹1,800 (resistance). A breakout above ₹1,800 could signal further upside potential.
Recent Performance: The stock has shown a 15.14% increase over the past month, indicating strong short-term performance .
Conclusion:
Concord Biotech Ltd is exhibiting bullish technical indicators with key support at ₹1,600 and resistance at ₹1,800. Traders should watch for a breakout above ₹1,800 for potential upward movement, while also being cautious of any reversal signals.
Hello Guys ..
WhatsApp link- wa.link/d997q0
Email - techncialexpress@gmail.com ...
Script Coder/Trader//Investor from India. Drop a comment or DM if you have any questions! Let’s grow together!
WhatsApp link- wa.link/d997q0
Email - techncialexpress@gmail.com ...
Script Coder/Trader//Investor from India. Drop a comment or DM if you have any questions! Let’s grow together!
Related publications
Disclaimer
The information and publications are not meant to be, and do not constitute, financial, investment, trading, or other types of advice or recommendations supplied or endorsed by TradingView. Read more in the Terms of Use.